. 2016 Apr 13;283(1828):20152988.
doi: 10.1098/rspb.2015.2988.

Finding the gap: a brightness-based strategy for guidance in cluttered environments

Affiliations

Finding the gap: a brightness-based strategy for guidance in cluttered environments

Emily Baird et al. Proc Biol Sci. .

Abstract

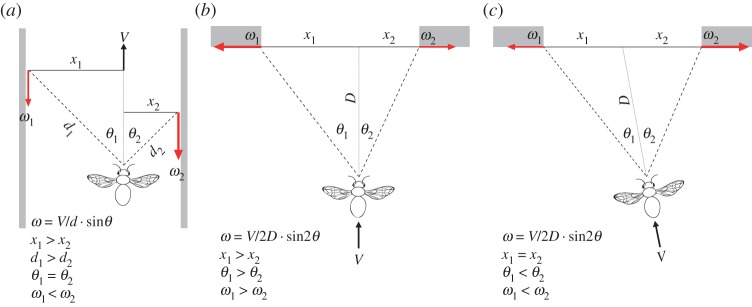
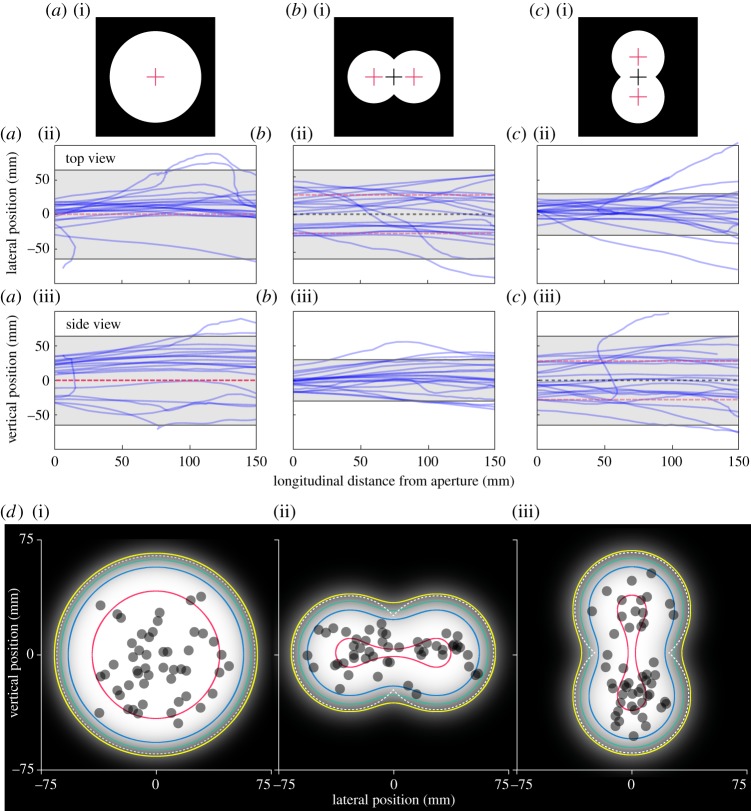
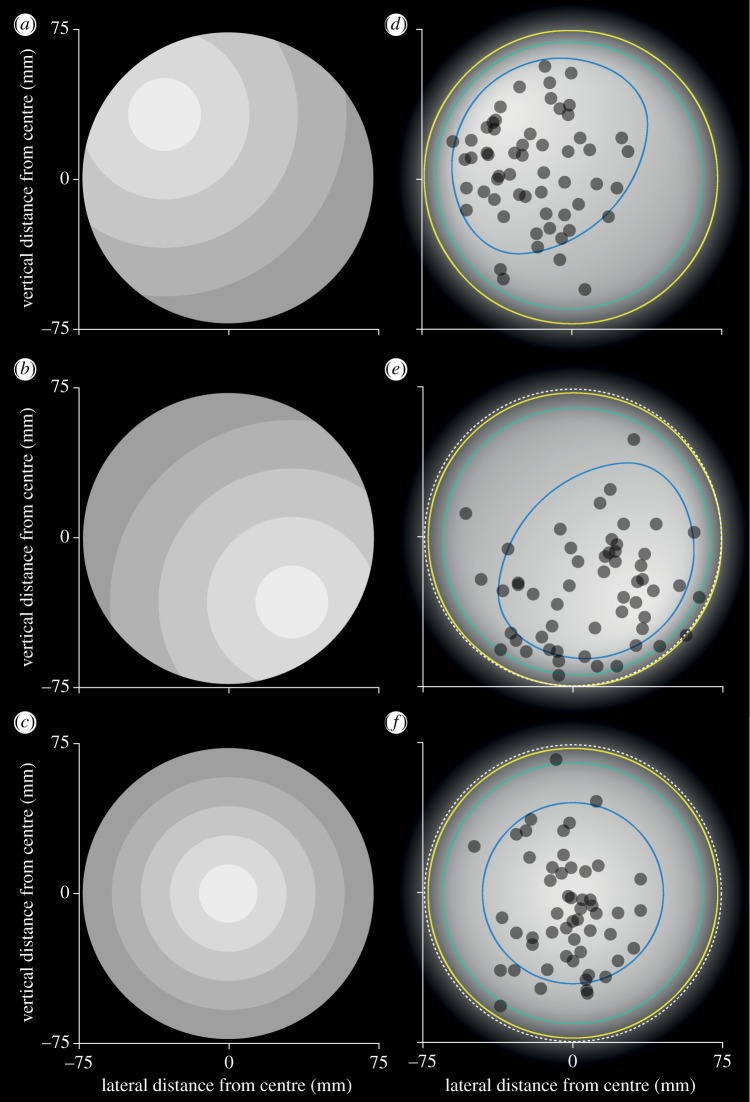
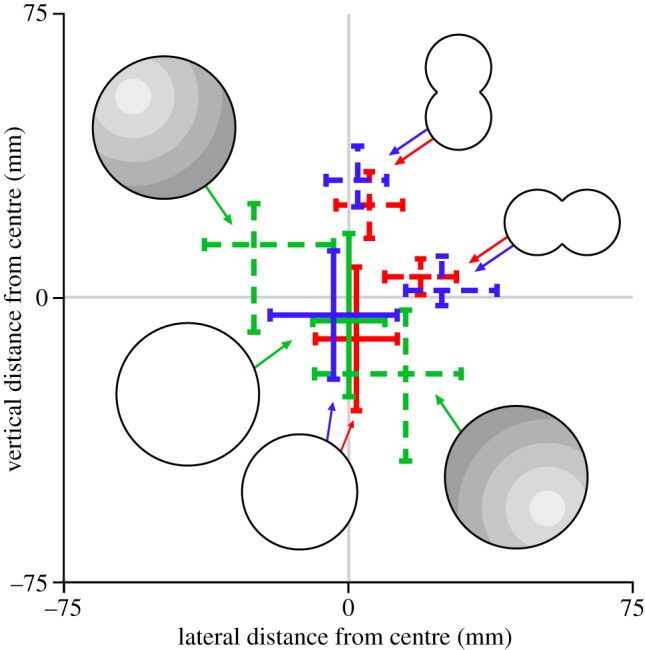
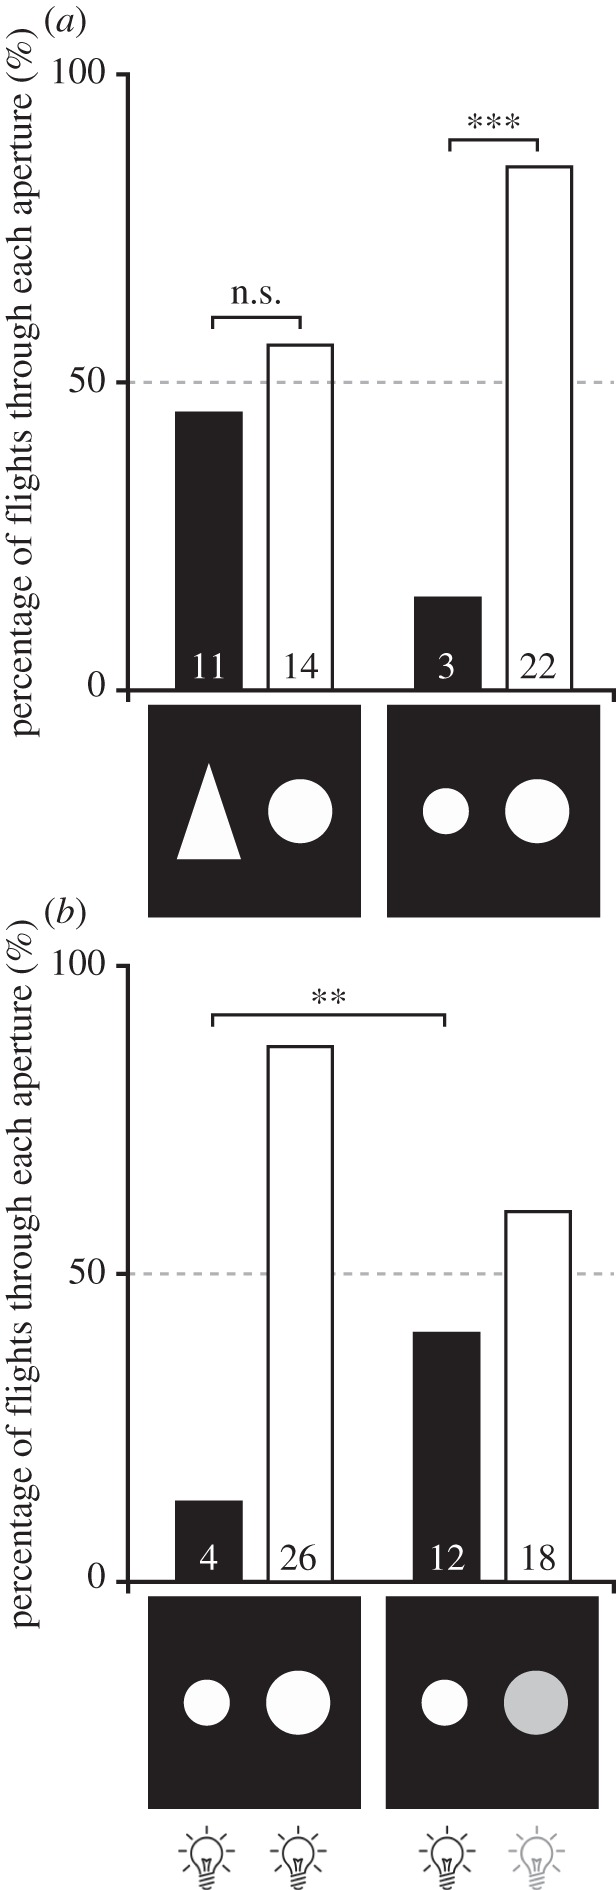
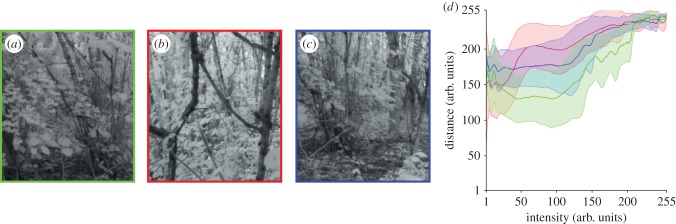
The ability to move safely between obstacles is critical for animals that fly rapidly through cluttered environments but surprisingly little is known about how they achieve this. Do they reactively avoid obstacles or do they instead fly towards the gaps between them? If they aim towards gaps, what information do they use to detect and fly through them? Here, we aim to answer these questions by presenting orchid bees with different apertures. When negotiating gaps, orchid bees locate and fly close to the point that gives them greatest clearance from the edges. The cue that they use to pinpoint this spot is the brightness gradient formed across the aperture. Furthermore, we find that orchid bees also rely on brightness cues to locate gaps that are sufficiently large to negotiate safely. The advantage of using brightness for locating and negotiating gaps in a cluttered environment is that it provides information about the safest path through obstacles, at least in a forest environment. This brightness-based guidance strategy for gap detection and negotiation represents a fast, computationally simple and efficient mechanism to identify the clearest path through a forest and is, therefore, likely to represent a more general mechanism used by other animals.

Keywords: brightness; flight; guidance; insect; orchid bee; vision.


Figures

Figure 1.
Figure 1.
The pattern of motion generated on the eye of a bee flying along a corridor or through apertures. The relative difference in the magnitude of optic flow (ω, red arrows), generated by points on the walls on each side of a corridor on the eyes of a bee flying with a different distance to each wall (d) but viewing them at the same angle (Θ, a). The relationship between the direction and magnitude of optic flow (red arrows) generated by the edges of an aperture on the eye of a bee flying on a perpendicular but off-centre trajectory (b) or diagonally towards the centre of an aperture (c). D, the perpendicular distance to the aperture; X, lateral distance to the point generating the optic flow.
Figure 2.
Figure 2.
Orchid bees fly towards the point of greatest clearance of an aperture. Bees were presented with a 130 mm circular aperture (a)(i) or double circle aperture oriented horizontally (b)(i) or vertically (c)(i). Red crosses mark the point of greatest clearance in the aperture (which coincides with the geometric centre in the circle), grey crosses mark the geometric centre. The flight paths (blue lines) of the bees flying out of these apertures are shown in top view ((a)(ii)–(c)(ii)) and side view ((a)(iii)–(c)(iii)). Grey areas indicate the width of the aperture, red dashed lines indicate the position of the point of greatest clearance and black dashed lines indicate the geometric centre of the double circle aperture for each orientation. ((d)(i–iii)) The apertures shown in ((a)(i)–(c)(i), respectively) processed with a Gaussian blur to represent how they might be perceived by orchid bees at a distance of 400 mm. Contours enclose levels of contrast between the bright pixels and the dark edge beginning with 40% (yellow), 60% (green), 80% (blue) and 100% (red). White dashed lines mark the physical edge of the aperture. Overlaid on the plots are the positions of orchid bees (grey dots) when presented with the 130 mm diameter circular aperture ((d)(i), see also (a)(i)) or a double circular aperture oriented horizontally ((d)(ii), see also (b)(i)) or vertically ((d)(iii), see also (c)(i)).
Figure 3.
Figure 3.
Orchid bees fly towards the brightest point in an aperture. (ac) Bees were presented with 150 mm circular apertures in which the position of the centre of brightness had been manipulated using a series of overlapping neutral density filters. The centre of brightness was moved 45° up and left (a), down and right (b) or centred (c). (df) The apertures shown in (ac) processed to represent how it might be perceived by orchid bees (other details as in figure 2d).
Figure 4.
Figure 4.
A summary of the positions of orchid bees attempting to exit the apertures from all treatments. Each cross indicates the median and the extent of the IQR for the lateral and vertical distance from the geometric centre of the apertures presented in this study. Solid lines indicate the extent of data from the open (blue) or covered with a diffuser 130 mm diameter circular aperture (red). Dashed lines represent the data from treatments when the centre of brightness was shifted away from the geometric centre of the aperture either by using a horizontal or vertically oriented double circle (open: blue; covered with a diffuser: red; note: the calculation for the double circle apertures was performed using absolute values for direct comparison with the 130 mm diameter circular aperture) or by creating an artificial brightness gradient shifted 45° up and left, or 45° down and right (green).
Figure 5.
Figure 5.
Orchid bees use brightness cues to determine the size of an aperture. (a) The percentage choice of aperture when presented with a triangle (60 mm wide, 90 mm high) and a 60 mm diameter circle or with two circles, 43.4 mm and 60 mm in diameter. Black bars indicate the percentage of bees that flew through the aperture with the smallest greatest clearance to the edges; white bars represent the percentage of bees that flew through the 60 mm diameter aperture. (b) The aperture choice when bees were presented with the 43.4 mm and 60 mm diameter apertures that were either illuminated with lights of the same intensity (left bars) or when the intensity of the light behind the larger aperture was dimmed (right bars). Numbers indicate the number of individuals that flew through each aperture.
Figure 6.
Figure 6.
The relationship between brightness and distance in a forest. (ac) Images taken in a forest using a three-dimensional camera (Raytrix, Germany). (d) An analysis of the images in (a) (green data), (b) (blue data) and (c) (red data) showing the mean and standard deviation of relative distance as a function of relative intensity (both in arbitrary units).

References

    1. Lin H-T, Ros IG, Biewener AA. 2014. Through the eyes of a bird: modelling visually guided obstacle flight. J. R. Soc. Interface 11, 20140239 (doi:10.1098/rsif.2014.0239) - DOI - PMC - PubMed
    1. Bhagavatula Partha S, Claudianos C, Ibbotson Michael R, Srinivasan Mandyam V. 2011. Optic flow cues guide flight in birds. Curr. Biol. 21, 1794–1799. (doi:10.1016/j.cub.2011.09.009) - DOI - PubMed
    1. Dyhr JP, Higgins CM. 2010. The spatial frequency tuning of optic-flow-dependent behaviours in the bumblebee Bombus impatiens. J. Exp. Biol. 213, 1643–1650. (doi:10.1242/jeb.041426) - DOI - PMC - PubMed
    1. Portelli G, Serres J, Ruffier F, Franceschini N. 2010. Modelling honeybee visual guidance in a 3-D environment. J. Physiol. Paris 104, 27–39. (doi:10.1016/j.jphysparis.2009.11.011) - DOI - PubMed
    1. Srinivasan MV, Lehrer M, Kirchner WH, Zhang SW. 1991. Range perception through apparent image speed in freely flying honeybees. Vis. Neurosci. 6, 519–535. (doi:10.1017/S095252380000136X) - DOI - PubMed

Publication types