. 2016 May;11(5):882-94.
doi: 10.1038/nprot.2016.044. Epub 2016 Apr 7.

Integration and global analysis of isothermal titration calorimetry data for studying macromolecular interactions

Affiliations

Integration and global analysis of isothermal titration calorimetry data for studying macromolecular interactions

Chad A Brautigam et al. Nat Protoc. 2016 May.

Abstract

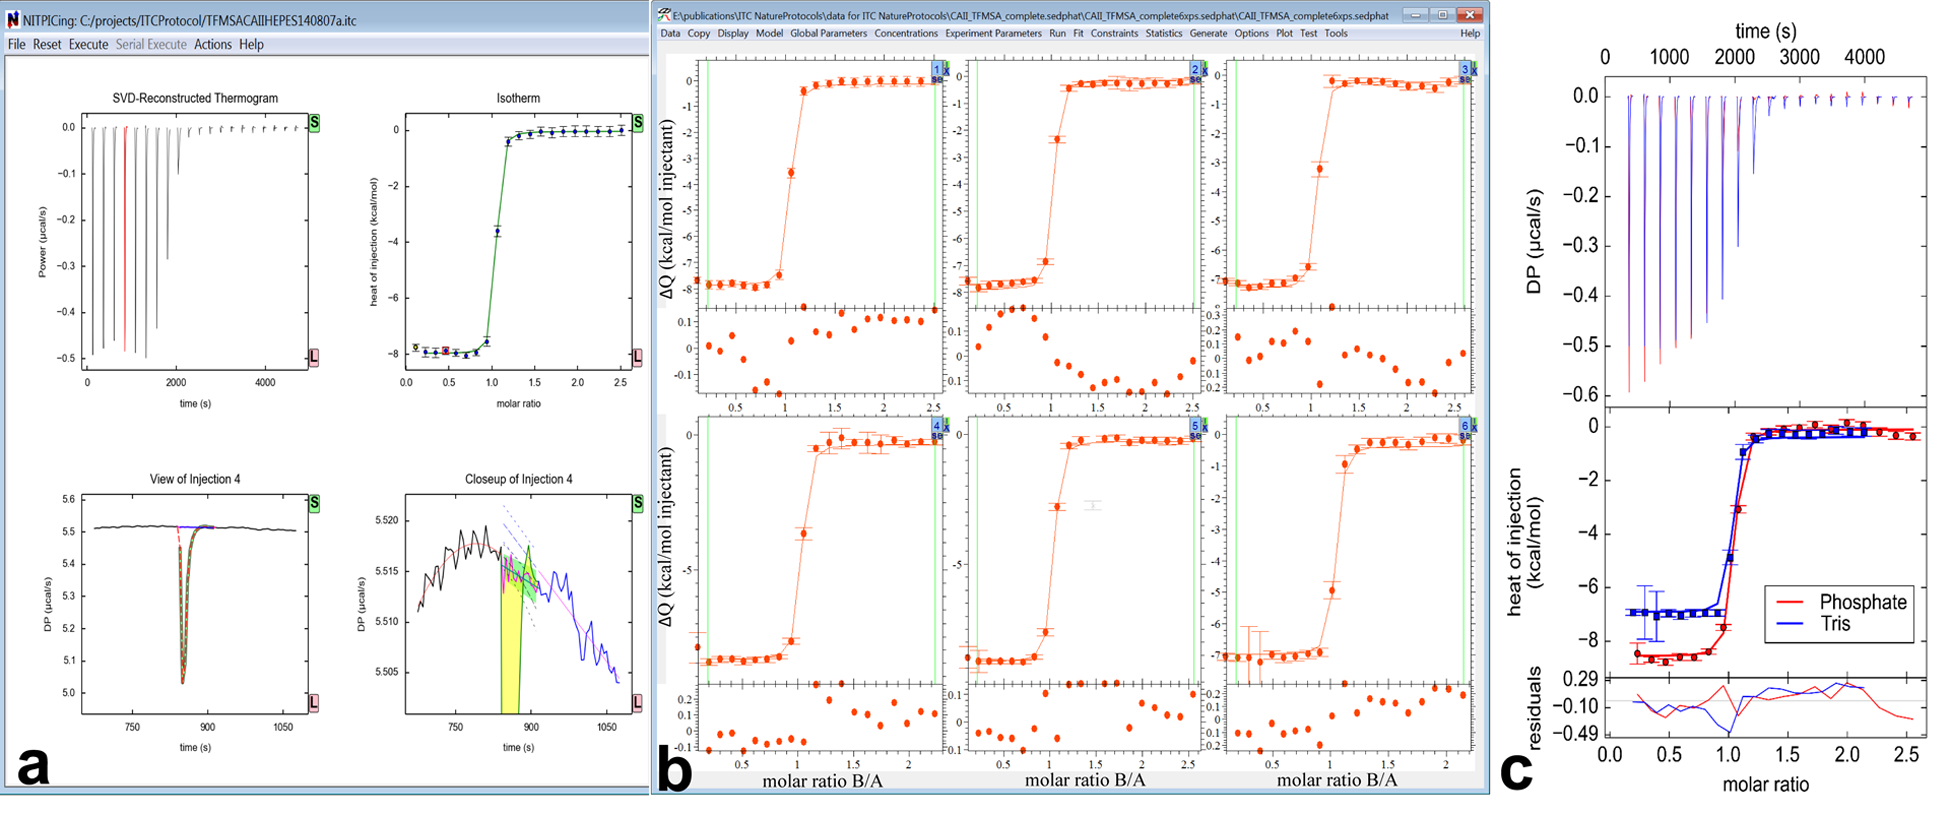
Isothermal titration calorimetry (ITC) is a powerful and widely used method to measure the energetics of macromolecular interactions by recording a thermogram of differential heating power during a titration. However, traditional ITC analysis is limited by stochastic thermogram noise and by the limited information content of a single titration experiment. Here we present a protocol for bias-free thermogram integration based on automated shape analysis of the injection peaks, followed by combination of isotherms from different calorimetric titration experiments into a global analysis, statistical analysis of binding parameters and graphical presentation of the results. This is performed using the integrated public-domain software packages NITPIC, SEDPHAT and GUSSI. The recently developed low-noise thermogram integration approach and global analysis allow for more precise parameter estimates and more reliable quantification of multisite and multicomponent cooperative and competitive interactions. Titration experiments typically take 1-2.5 h each, and global analysis usually takes 10-20 min.


Conflict of interest statement

COMPETING FINANCIAL INTERESTS

The authors declare that they have no competing financial interests

Figures

Figure 1.
Figure 1.
Workflow of global ITC analysis using NITPIC (a), SEDPHAT/ITCsy (b) and GUSSI (c). (a) The NITPIC window is shown after integration of a thermogram (control panel not shown). After a mouse click on one of the injections shown in the reconstructed thermograms (upper left) or isotherm (upper right) plots, a view of the isolated injection appears with raw thermogram data, reconstructed injection shapes and baseline (lower left), and a zoomed-in view of that same injection (lower right) highlighting the integrated area in yellow and the assigned baseline during injection in magenta. The latter plot also shows the extrapolated pre-and post-injection baselines that yield the estimated error of the integral (green). (b) A screenshot of SEDPHAT after importing six isotherms and performing a global analysis. Buttons in the upper right corner of each plot lead to the experimental parameter input (Figure 2). (c) The GUSSI output for two of the ten proton-linkage experiments described in this protocol. The top panel shows the SVD-reconstructed thermograms provided by NITPIC, the middle panel the isotherms, and the bottom panel the residuals. All elements are colored as indicated in the inset legend. DP stands for “Differential Power”.
Figure 2.
Figure 2.
The Experimental Parameter window in SEDPHAT. Highlighted are the fields for specifying the identity of syringe and cell components (magenta) as well as the entries for concentrations (red) and buffer parameters (blue).
Figure 3.
Figure 3.
Removing an outlying data point in SEDPHAT. Close-ups of the SEDPHAT global analysis window for experiment 8 is shown (a) before outlier removal, with the outlier data point circled for clarity, and (b) after outlier removal with the “Exclude Isotherm Data Points” function; SEDPHAT shows excluded points in grey. Repeat execution of the same function allows re-inserting points into the pool of points to be fitted.
Figure 4.
Figure 4.
An experiment before and after fitting. The format is the same as Fig. 3. (a) The fit line after a “Global Run” was performed (Step 14). There is a clear mismatch between this line and the experimental data, and the residuals are large. (b) The fit line after final refinement. There is a much closer correspondence between the data and the fit, and the residuals are smaller and clustered around 0.
Figure 5.
Figure 5.
A GUSSI plot of a ten-titration global analysis of randomly methylated β-cyclodextrin (mβCD) binding to the nonionic detergent n-octyl-β-D-maltopyranoside (OM), acquired at different temperatures to determine ΔCp°. Knowledge of the stability and stoichiometry of inclusion complexes is of practical importance, for instance, for optimizing detergent complexation in the process of membrane-protein reconstitution, and thermodynamic parameters such as ΔCp° provide additional insights into the thermodynamics underlying these interactions. Specifically, we performed titrations of OM with mβCD (circles) as well as of mβCD with OM (triangles) at five different temperatures on a VP-ITC instrument (Malvern Instruments). Raw thermograms were processed using the serial integration function in NITPIC and directly saved as a SEDPHAT configuration. Global data analysis was accomplished with the “A + B ↔ AB Hetero-Association Global Temperature Variation Analysis” model, which SEDPHAT offers only if multiple datasets acquired at different temperatures have been loaded. The excellent agreement over a broad temperature range for both ‘forward’ and ‘reverse’ titrations lends credence to the simple 1:1 binding model assumed. The negative best-fit value of ΔCp° = −127 cal/(mol K) is a signature of hydrophobic interactions, and the 68.3% confidence interval ranging from −136 cal/(mol K) to −120 cal/(mol K) attests to the high precision afforded by global analysis.
Figure 6.
Figure 6.
Example of the global ITC analysis of a three-protein interaction analyzed in SEDPHAT and plotted in GUSSI. The experiments examined reversible binding that occurs among the adaptor proteins LAT, Grb2, and Sos1 after T-cell activation: While Sos1 and LAT do not interact and occupy different, single sites on Grb2, multi-phosphorylated LAT is multivalent for Grb2, and Sos1 is bivalent for Grb2, leading to the oligomerization of ternary signaling complexes and initiating signal transduction. In the experiments shown (reproduced from ref.), the system is limited to a subset of reactions by using LAT1p, which in its singly phosphorylated form is monovalent for Grb2, and a N-terminal fragment of Sos1 which has only a single site for Grb215. The interaction scheme matches the “A + B +C ↔ AB + C ↔ AC + B ↔ ABC“ variant of the ternary interactions models in SEDPHAT. Plotted are a titration of Grb2 into SoS1NT (green, reduced in scale by a factor ten), a titration of LAT1p into Grb2 (blue) and a titration of LAT1p into the same concentration of Grb2 in an equimolar mixture with Sos1NT (magenta). Global analysis (as described in ref.) suggests slight cooperativity with ΔΔH° = −4.0 kcal/mol (68% confidence interval from −7.8 to −1.6 kcal/mol) and ΔΔG° = 0.38 kcal/mol (68% confidence interval from 0.11 to 0.65 kcal/mol).
Figure 7.
Figure 7.
Global multi-method analysis in SEDPHAT of the two-site interaction of α-chymotrypsin (CT) binding to soybean trypsin inhibitor (SBTI), complementing ITC data (a) with surface plasmon resonance (SPR) surface competition isotherm data (b), sedimentation velocity isotherms (c), and fluorescence polarization data (not shown). (a) Normalized heats of reaction measured in calorimetry from the titration of 20 μM CT with aliquots of 84 μM SBTI (symbols); (b) Steady-state SPR biosensor signals from binding of 0.3 μM CT to surface-immobilized SBTI in the presence of different concentrations of soluble SBTI as a competitor (symbols). (c) Weight-average (circles) and reaction boundary (squares) sedimentation coefficients in SV-AUC for 1.8 μM SBTI with different concentrations of CT. Data are taken from the GMMA analysis described in detail in Zhao & Schuck consisting of a more comprehensive set of data from 10 experiments, which, in contrast to any single-technique analysis, allowed the thermodynamic binding parameters of both sites to be determined precisely.

References

    1. Robinson CV, Sali A & Baumeister W The molecular sociology of the cell. Nature 450, 973–82 (2007). - PubMed
    1. Cebecauer M, Spitaler M, Sergé A & Magee AI Signalling complexes and clusters: functional advantages and methodological hurdles. J. Cell Sci 123, 309–20 (2010). - PubMed
    1. Ladbury JE & Arold ST Noise in cellular signaling pathways: causes and effects. Trends Biochem. Sci 37, 173–178 (2012). - PMC - PubMed
    1. Ladbury JE, Klebe G & Freire E Adding calorimetric data to decision making in lead discovery: a hot tip. Nat. Rev. Drug Discov 9, 23–7 (2010). - PubMed
    1. Chaires JB Calorimetry and thermodynamics in drug design. Annu. Rev. Biophys 37, 135–51 (2008). - PubMed

Publication types

MeSH terms

Substances