

Leptin Production by Encapsulated Adipocytes Increases Brown Fat, Decreases Resistin, and Improves Glucose Intolerance in Obese Mice
- PMID: 27055280
- PMCID: PMC4824514
- DOI: 10.1371/journal.pone.0153198
Leptin Production by Encapsulated Adipocytes Increases Brown Fat, Decreases Resistin, and Improves Glucose Intolerance in Obese Mice
Abstract
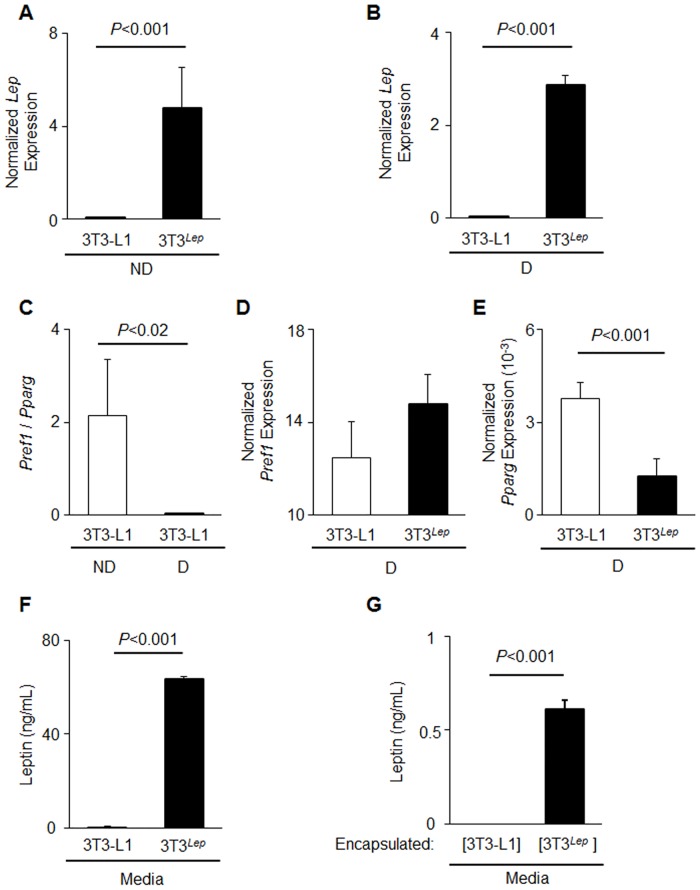
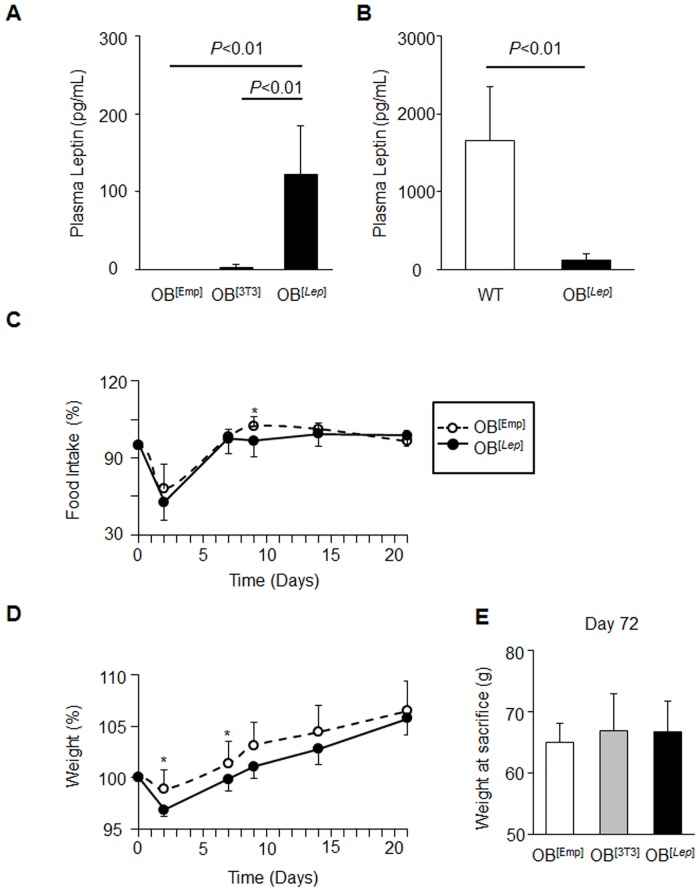
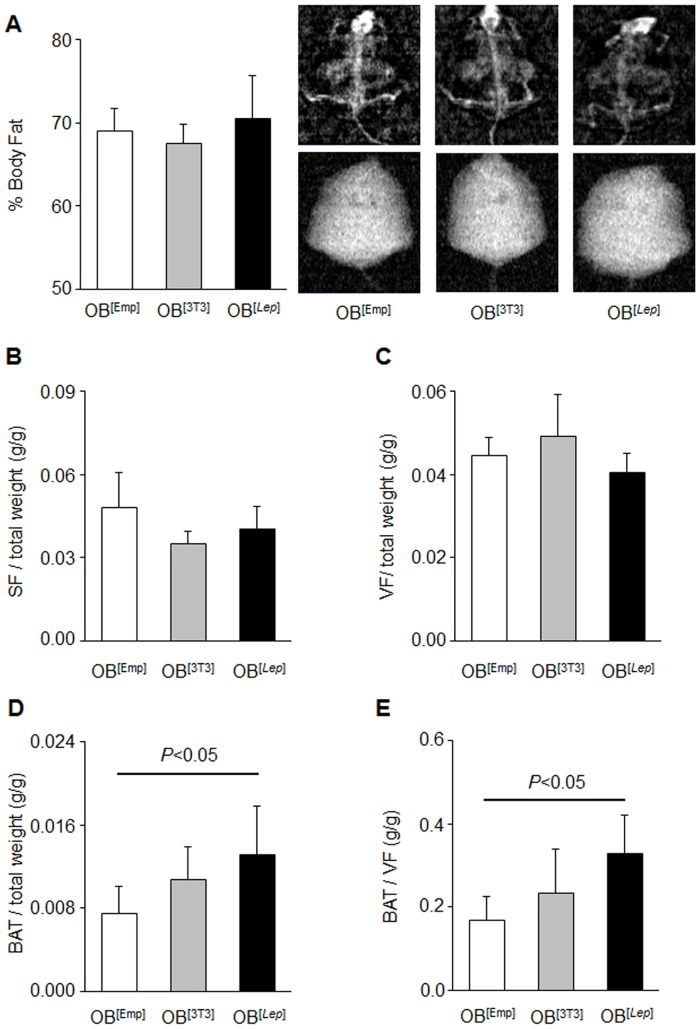
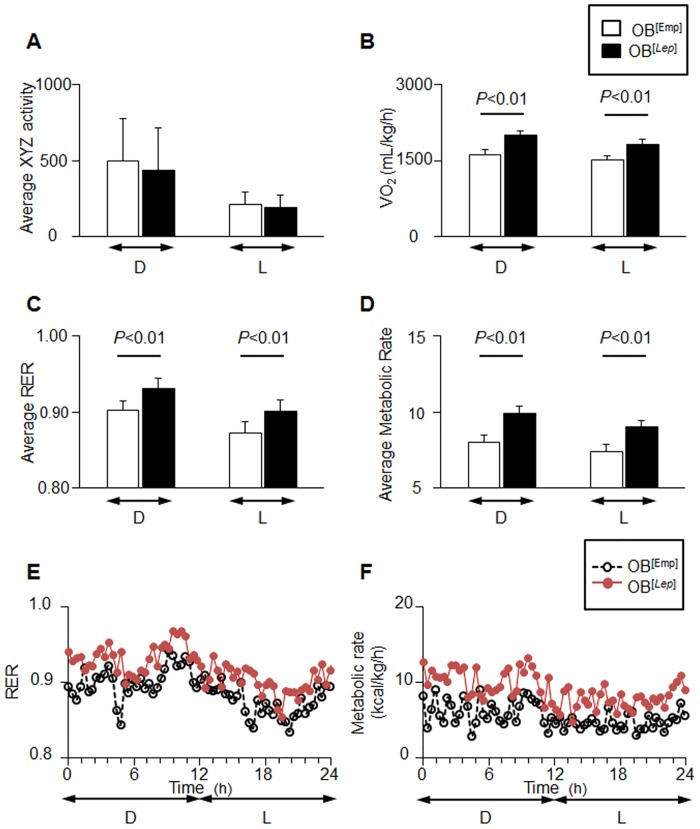
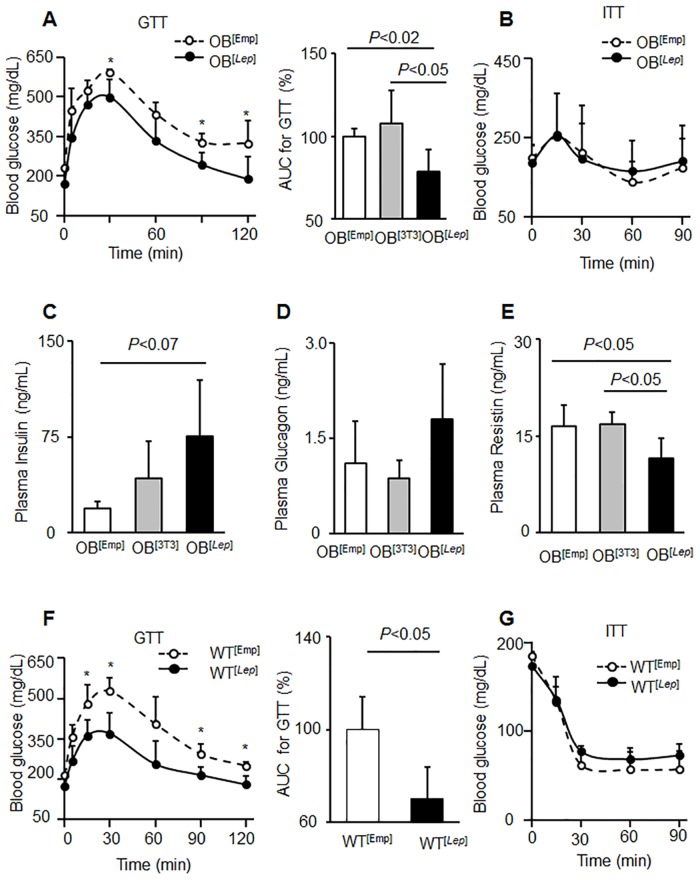
The neuroendocrine effects of leptin on metabolism hold promise to be translated into a complementary therapy to traditional insulin therapy for diabetes and obesity. However, injections of leptin can provoke inflammation. We tested the effects of leptin, produced in the physiological adipocyte location, on metabolism in mouse models of genetic and dietary obesity. We generated 3T3-L1 adipocytes constitutively secreting leptin and encapsulated them in a poly-L-lysine membrane, which protects the cells from immune rejection. Ob/ob mice (OB) were injected with capsules containing no cells (empty, OB[Emp]), adipocytes (OB[3T3]), or adipocytes overexpressing leptin (OB[Lep]) into both visceral fat depots. Leptin was found in the plasma of OB[Lep], but not OB[Emp] and OB[3T3] mice at the end of treatment (72 days). The OB[Lep] and OB[3T3] mice have transiently suppressed appetite and weight loss compared to OB[Emp]. Only OB[Lep] mice have greater brown fat mass, metabolic rate, and reduced resistin plasma levels compared to OB[Emp]. Glucose tolerance was markedly better in OB[Lep] vs. OB[Emp] and OB[3T3] mice as well as in wild type mice with high-fat diet-induced obesity and insulin resistance treated with encapsulated leptin-producing adipocytes. Our proof-of-principle study provides evidence of long-term improvement of glucose tolerance with encapsulated adipocytes producing leptin.
Conflict of interest statement
Figures
Similar articles
-
Leptin treatment markedly increased plasma adiponectin but barely decreased plasma resistin of ob/ob mice.Am J Physiol Endocrinol Metab. 2004 Sep;287(3):E446-53. doi: 10.1152/ajpendo.00488.2003. Epub 2004 May 4. Am J Physiol Endocrinol Metab. 2004. PMID: 15126241
-
Quantitative comparison of adipocytokine gene expression during adipocyte maturation in non-obese and obese rats.Biol Pharm Bull. 2011;34(6):865-70. doi: 10.1248/bpb.34.865. Biol Pharm Bull. 2011. PMID: 21628885
-
Changes in glycemia by leptin administration or high- fat feeding in rodent models of obesity/type 2 diabetes suggest a link between resistin expression and control of glucose homeostasis.Endocrinology. 2004 May;145(5):2206-13. doi: 10.1210/en.2003-1679. Epub 2004 Feb 12. Endocrinology. 2004. PMID: 14962997
-
Roles of leptin and resistin in metabolism, reproduction, and leptin resistance.Domest Anim Endocrinol. 2020 Oct;73:106472. doi: 10.1016/j.domaniend.2020.106472. Epub 2020 Mar 6. Domest Anim Endocrinol. 2020. PMID: 32265081 Review.
-
To be lean or not to be lean. Is leptin the answer?Exp Clin Endocrinol Diabetes. 1998;106(1):1-15. doi: 10.1055/s-0029-1211943. Exp Clin Endocrinol Diabetes. 1998. PMID: 9516053 Review.
Cited by
-
Brown and Brite: The Fat Soldiers in the Anti-obesity Fight.Front Physiol. 2019 Jan 30;10:38. doi: 10.3389/fphys.2019.00038. eCollection 2019. Front Physiol. 2019. PMID: 30761017 Free PMC article. Review.
-
Epiregulin as an Alternative Ligand for Leptin Receptor Alleviates Glucose Intolerance without Change in Obesity.Cells. 2022 Jan 26;11(3):425. doi: 10.3390/cells11030425. Cells. 2022. PMID: 35159237 Free PMC article.
-
Hypothalamic administration of sargahydroquinoic acid elevates peripheral thermogenic signaling and ameliorates high fat diet-induced obesity through the sympathetic nervous system.Sci Rep. 2021 Oct 29;11(1):21315. doi: 10.1038/s41598-021-00074-3. Sci Rep. 2021. PMID: 34716371 Free PMC article.
-
Aldehyde dehydrogenase 1 a1 regulates energy metabolism in adipocytes from different species.Xenotransplantation. 2017 Sep;24(5):10.1111/xen.12318. doi: 10.1111/xen.12318. Epub 2017 Jul 17. Xenotransplantation. 2017. PMID: 28718514 Free PMC article.
-
Mouse Embryonic Fibroblasts Protect ob/ob Mice From Obesity and Metabolic Complications.Endocrinology. 2018 Sep 1;159(9):3275-3286. doi: 10.1210/en.2018-00561. Endocrinology. 2018. PMID: 30085057 Free PMC article.
References
-
- Ogden CL, Carroll MD, Kit BK, Flegal KM. Prevalence of Obesity in the United States, 2009–2010. NCHS Data Brief. 2012;(82). - PubMed
-
- Ginter E, Simko V. Type 2 diabetes mellitus, pandemic in 21st century. Advances in experimental medicine and biology. 2012;771:42–50. . - PubMed
-
- Orchard TJ, Olson JC, Erbey JR, Williams K, Forrest KY, Smithline Kinder L, et al. Insulin resistance-related factors, but not glycemia, predict coronary artery disease in type 1 diabetes: 10-year follow-up data from the Pittsburgh Epidemiology of Diabetes Complications Study. Diabetes Care. 2003;26(5):1374–9. . - PubMed
Publication types
MeSH terms
Substances
Grants and funding
LinkOut - more resources
Full Text Sources
Other Literature Sources
Medical
Miscellaneous
