. 2016 Mar-Apr;10(2):356-67.
doi: 10.1016/j.jacl.2015.12.007. Epub 2015 Dec 23.

Familial lecithin:cholesterol acyltransferase deficiency: First-in-human treatment with enzyme replacement

Affiliations

Familial lecithin:cholesterol acyltransferase deficiency: First-in-human treatment with enzyme replacement

Robert D Shamburek et al. J Clin Lipidol. 2016 Mar-Apr.

Abstract

Background: Humans with familial lecithin:cholesterol acyltransferase (LCAT) deficiency (FLD) have extremely low or undetectable high-density lipoprotein cholesterol (HDL-C) levels and by early adulthood develop many manifestations of the disorder, including corneal opacities, anemia, and renal disease.

Objective: To determine if infusions of recombinant human LCAT (rhLCAT) could reverse the anemia, halt progression of renal disease, and normalize HDL in FLD.

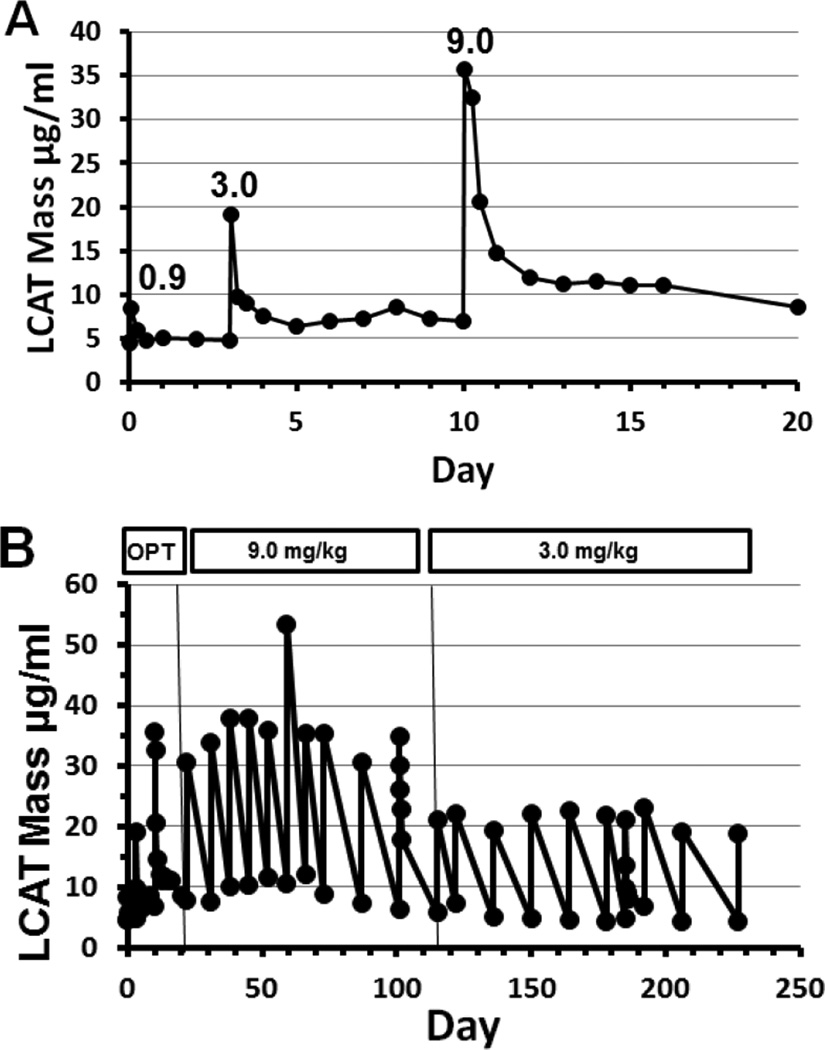
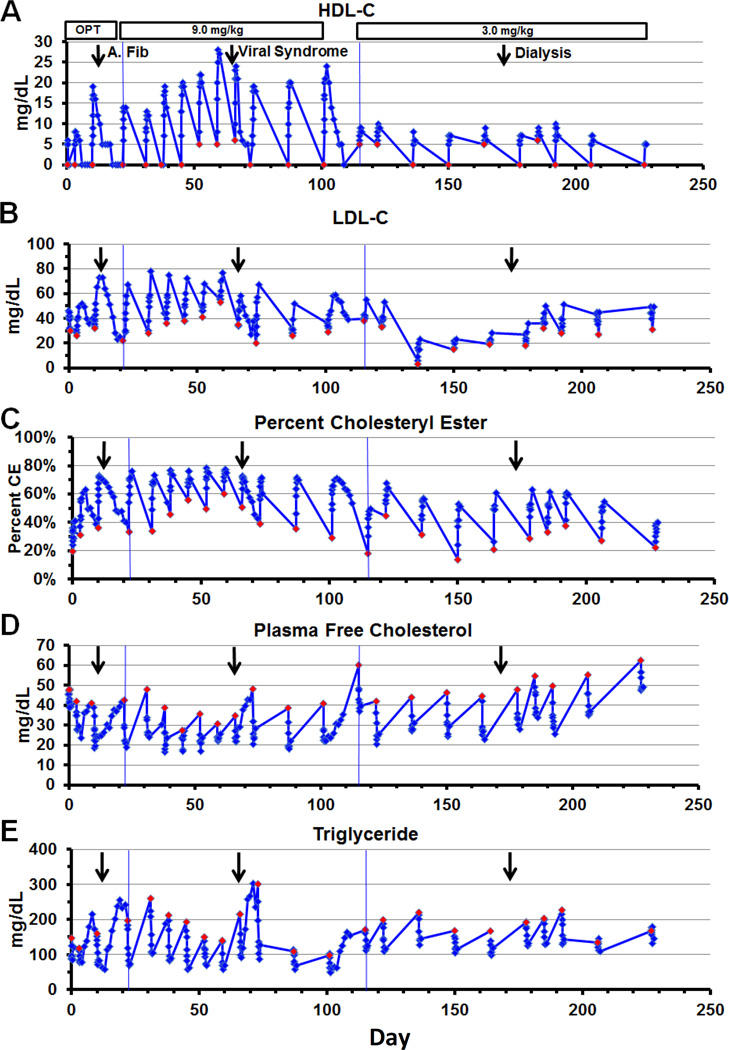
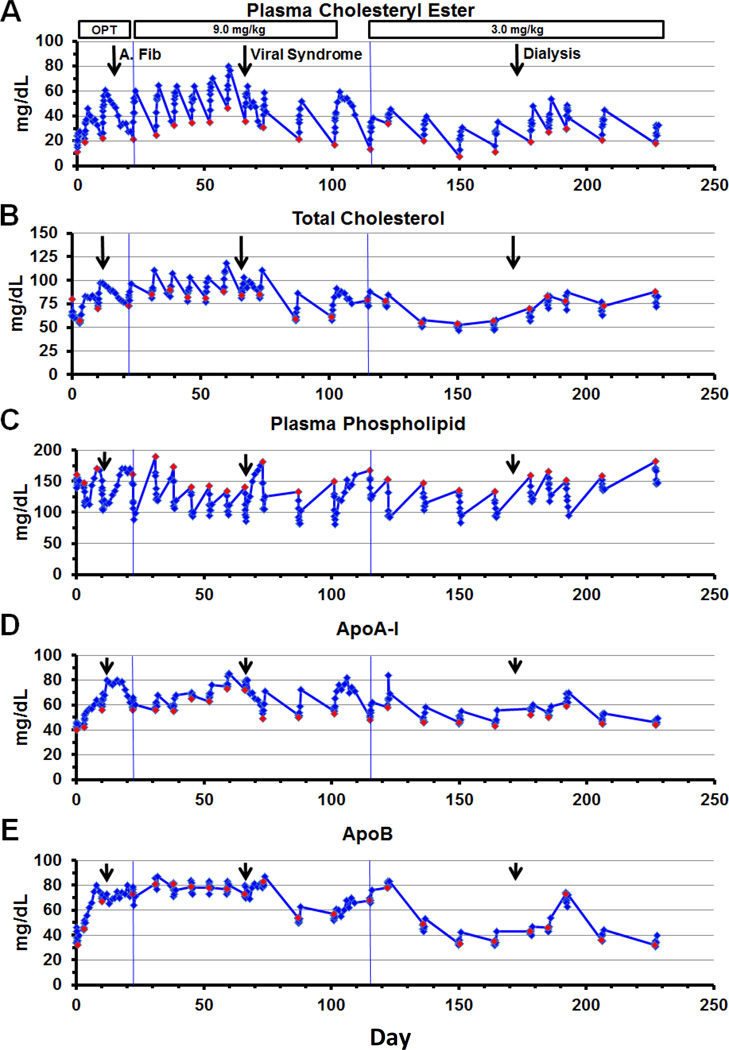
Methods: rhLCAT (ACP-501) was infused intravenously over 1 hour on 3 occasions in a dose optimization phase (0.3, 3.0, and 9.0 mg/kg), then 3.0 or 9.0 mg/kg every 1 to 2 weeks for 7 months in a maintenance phase. Plasma lipoproteins, lipids, LCAT levels, and several measures of renal function and other clinical labs were monitored.

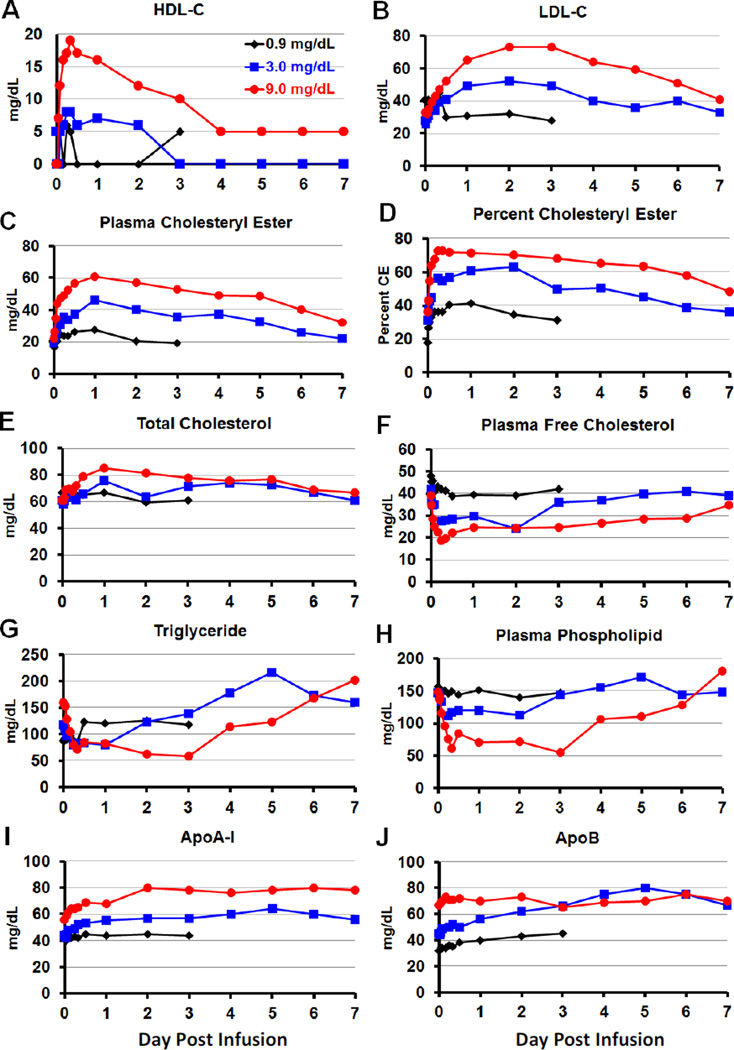
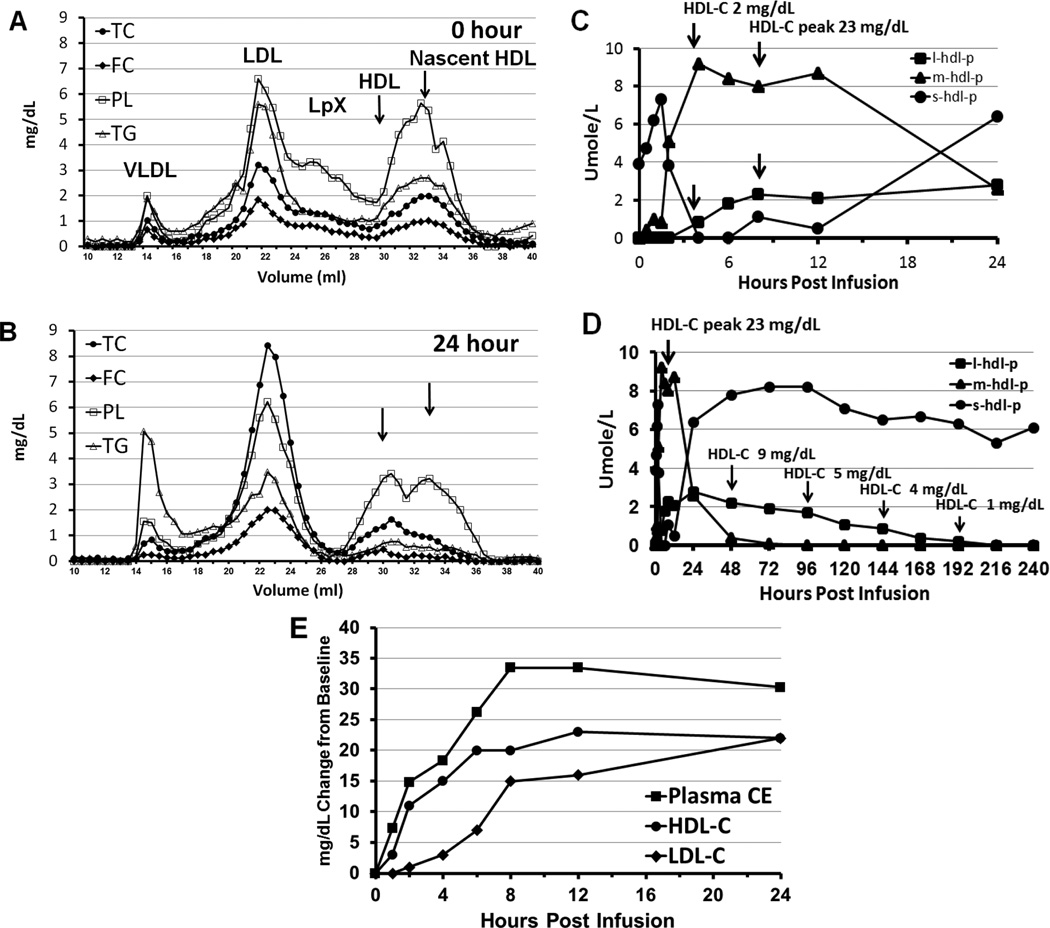
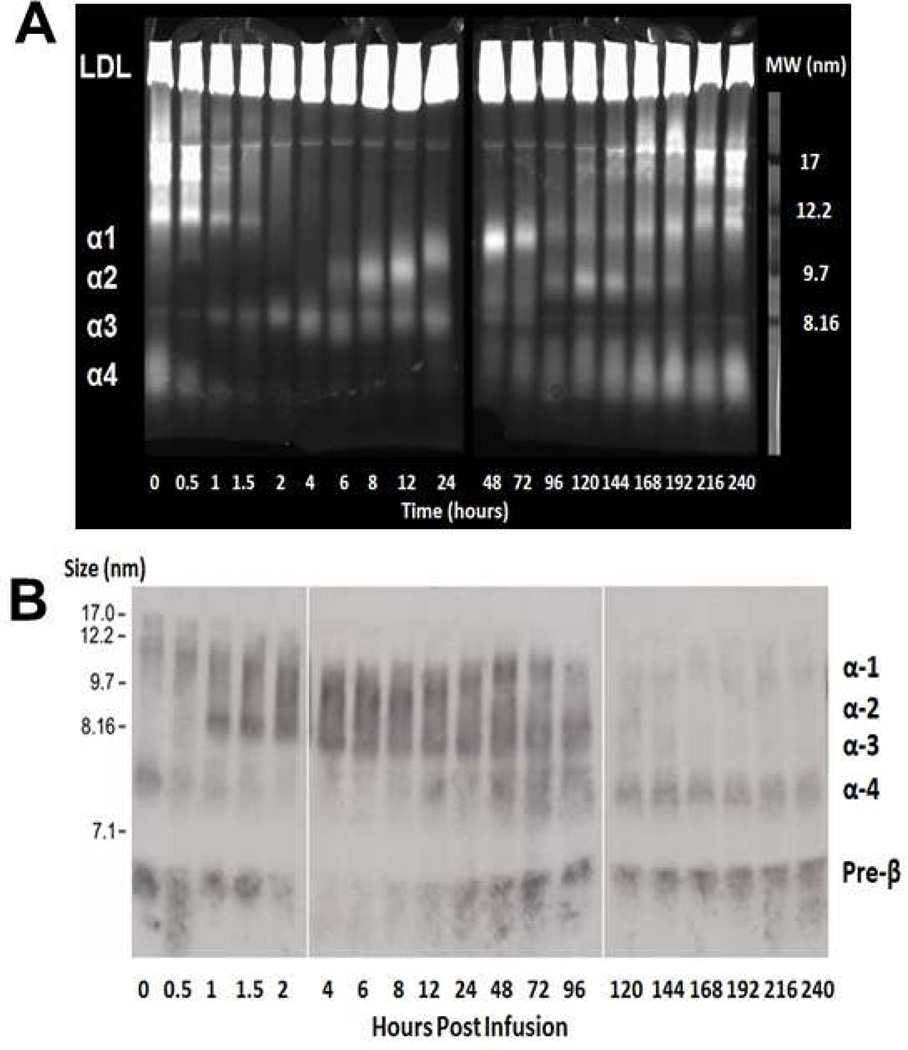
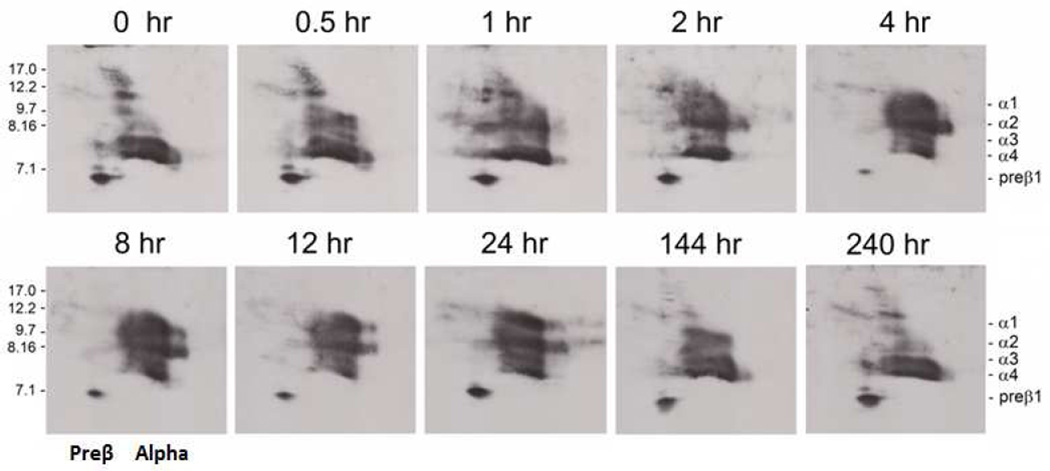
Results: LCAT concentration peaked at the end of each infusion and decreased to near baseline over 7 days. Renal function generally stabilized or improved and the anemia improved. After infusion, HDL-C rapidly increased, peaking near normal in 8 to 12 hours; analysis of HDL particles by various methods all revealed rapid sequential disappearance of preβ-HDL and small α-4 HDL and appearance of normal α-HDL. Low-density lipoprotein cholesterol increased more slowly than HDL-C. Of note, triglyceride routinely decreased after meals after infusion, in contrast to the usual postprandial increase in the absence of rhLCAT infusion.

Conclusions: rhLCAT infusions were well tolerated in this first-in-human study in FLD; the anemia improved, as did most parameters related to renal function in spite of advanced disease. Plasma lipids transiently normalized, and there was rapid sequential conversion of small preβ-HDL particles to mature spherical α-HDL particles.

Keywords: Cholesterol; HDL; LCAT; Lecithin cholesterol acyltransferase; Lecithin cholesterol acyltransferase deficiency; Lipoprotein-X; Recombinant enzyme replacement; Renal disease; Triglyceride.


Figures

Figure 1
Figure 1. LCAT mass during dose optimization and maintenance phases
(A) Optimization phase. LCAT mass was determined at 0, 1, 6, 12 and 24 hours and then daily following optimization phase doses of 0.9, 3.0, or 9.0 mg/kg administered i.v. over 1 hour. Peak concentrations of LCAT were observed at the end of the 1 hour infusion. LCAT mass increased with increasing dose. (B) Optimization (OPT) and maintenance phases. During maintenance phase, LCAT mass was determined just before and at the end of each infusion. On dose 13 (9.0 mg/kg) and dose 20 (3.0 mg/kg), LCAT mass was also determined at 6, 12, and 24 hours. Peak LCAT mass increased as the dose increased and was relatively constant with each dose.
Figure 2
Figure 2. Optimization phase - lipoproteins and lipids
Dose optimization phase included the 0.9 mg/kg dose (black) observed for 3 days, then a 3.0 mg/kg dose (blue) observed for 7 days, and then a 9.0 mg/kg dose (red) observed for 7 days. The rhLCAT infusion was given i.v. over 1 hour starting at time 0. Samples were taken at 0, 0.5, 1, 2, 4, 6, 8, 12 and 24 hours and then a fasting daily sample for up to 7 days. Atrial fibrillation occurred 3 days after the 9.0 mg/kg dose. The subject fasted for 12 hours before and during the infusion, and then resumed his regular diet. (A) HDL-C, (B) LDL-C, (C) Plasma CE, (D) Percent CE, (E) Plasma TC, (F) Plasma FC, (G) TG, (H) Plasma PL, (I) ApoA-I, and (J) ApoB.
Figure 3
Figure 3. Optimization (OPT) and maintenance phases - lipoproteins and lipids
Three doses (0.9, 3.0 and 9.0 mg/kg) were given between 0 and 21 days, during the optimization phase. Ten doses at 9.0 mg/kg maintenance phase were given usually weekly between day 22 and 114 and 10 doses at 3.0 mg/kg were given usually biweekly between day 115 and 228. The infusion was given i.v. over 1 hour and started at time 0. Blood was taken at 0, 1, 2, 4, 6, 8, 12 and 24 hours post infusion. Blood was taken daily for 1 week following the viral syndrome (dose 10) and following the last 9.0 mg/kg dose (dose 13). Atrial fibrillation occurred 3 days after dose 3 on day 13 (arrow). A viral syndrome started the day before dose 10 on day 65 (arrow). Hemodialysis started 1 week before dose 19 (arrow). Red diamonds represent time of infusion. The subject fasted for 12 hours before and during the infusion, and then resumed his regular diet. (A) HDL-C, (B) LDL-C, (C) Percent CE, (D) Plasma FC, and (E) TG.
Figure 4
Figure 4
Optimization (OPT) and maintenance phases - lipids and apolipoproteins Three doses (0.9, 3.0 and 9.0 mg/kg) were given between 0 and 21 days, during the optimization phase. Ten doses at 9.0 mg/kg maintenance phase were given usually weekly between day 22 and 114 and 10 doses at 3.0 mg/kg were given usually biweekly between day 115 and 228. The infusion was given i.v. over 1 hour and started at time 0. Blood was taken at 0, 1, 2, 4, 6, 8, 12 and 24 hours post infusion. Blood was taken daily for 1 week following the viral syndrome (dose 10) and following the last 9.0 mg/kg dose (dose 13). Atrial fibrillation occurred 3 days after dose 3 on day 13 (arrow). A viral syndrome started the day before dose 10 on day 65 (arrow). Hemodialysis started 1 week before dose 19 (arrow). Red diamonds represent time of infusion. (A) Plasma CE, (B) TC, (C) Plasma PL, (D) ApoA-I, and (E) ApoB.
Figure 5
Figure 5. Effect of rhLCAT infusion on lipid and lipoprotein levels
FPLC analysis of plasma lipids before (A) and 24 hours after (B) after the first 9.0 mg/kg rhLCAT infusion (optimization phase). (A) FPLC at 0 hour just before infusion. Lp-X like particles were identified as phospholipid-rich particles across broad size range. LDL-C was over 50% FC. Small nascent HDL predominates with near absence of HDL. (B) FPLC at 24 hours. Small nascent HDL particles were converted to larger CE-rich HDL-sized particles. The increase in TC to near normal levels was due to the formation of LDL-CE and HDL-CE since FC decreased. Baseline low LDL-C was increased to near normal CE-rich LDL levels 24 hours post infusion. NMR analysis of small (s), medium (m), and large (l) HDL over 24 hours (C) and 240 hours (D) after the first 9.0 mg/kg infusion. Small HDL was the only particle present at baseline, consistent with the α-4 HDL observed on the 1D and 2D gels. (C) The rhLCAT infusion was given i.v. over 1 hour starting at time 0. Small HDL, the substrate of rhLCAT, increased for 2 hours but then disappeared through 12 hours likely due to rapid precursor turnover. Medium HDL lipoproteins was absent at time 0 and after a brief delay peaked at 4 hours, the same time that large HDL appeared and HDL-C was measureable at 2 mg/dL. HDL-C peaked at 23 mg/dL at 8 hours concomitantly as large HDL peaked. (D) Small HDL reappeared by 24 hours correlating with α-4 HDL on 1D and 2D gels. Over the next 192 hours, HDL-C paralleled the slow decline and disappearance of large HDL. (E) Effect of rhLCAT infusion on HDL-C, LDL-C and plasma CE: mg/dL change from time 0. Increased plasma CE and HDL-C appeared within 1 hour and initially increased at the same rate. LDL-C increased after a 2 hour delay. From 4–8 hours, plasma cholesteryl ester continued to increase, approaching the sum of HDL-C and LDL-C. Data shown for dose 9 (9.0 mg/kg).
Figure 6
Figure 6. HDL subpopulations analysis by 1D gel electrophoresis following the first 9.0 mg/kg dose
(A) Plasma was subjected to electrophoresis on a 4–12% native acrylamideTris-Glycine gel stained with filipin, which stains free cholesterol as well as phospholipids. At baseline, there was only α-4 HDL FC and PL and a complete absence of large α-HDL. α-4 HDL, the substrate for rhLCAT, rapidly decreased at the end of the infusion at peak rhLCAT levels and reappeared after 24–48 hours. Larger sized α-HDL, the product of rhLCAT, was sequentially generated with α-3 HDL immediately appearing during the infusion. α-2 HDL appeared at 6 hours followed by α-1 HDL at 24 hours. Larger α-HDL slowly disappeared after 192 hours. 17 nm Lp-X particles rich in FC/PL were abundant at 0 hours, disappeared by 2 hours, gradually reappeared at 120 hours and returned to near baseline by 240 hours. (B) ApoA-I Western blot analysis of plasma subjected to electrophoresis on a 4–28% TBE gel. At baseline, there was only apoA-I on preβ-HDL and α-4 HDL. α-4 HDL, the substrate for rhLCAT, rapidly decreased at the end of the infusion at peak rhLCAT levels and reappeared after 24–48 hours, paralleling the appearance of CE and disappearance of FC. Larger sized α-HDL, the product of rhLCAT, was sequentially generated with α-3 HDL immediately appearing during the infusion. ApoA-I appeared on α-2 HDL by 1.5 hours followed quickly by α-1 HDL. ApoA-I on α-2 HDL and α-1 HDL disappeared after 120–144 hours post infusion and returned to the preinfusion preβ-HDL and α-4 HDL.
Figure 7
Figure 7. Native-native 2D gel analysis of apoA-I-containing HDL subpopulations
Fasting plasma at various times between 0 and 240 hours following the first 9.0 mg/kg infusion of rhLCAT was run on native-native 2D gels. ApoA-I was detected by immunoblotting with an anti-apoA-I antibody. Molecular size markers in nm are shown. Small apoA-I discoidal preβ1 HDL and small discoidal α-4 HDL along with a constellation of unusually large apoA-I containing particles between the preβ and α-migrating particles were present at 0 hour. During the 1 hour infusion, larger α-3 and α-2 HDL began to appear and the unusually large apoA-I particles shifted towards the alpha region of the gel. By 4 hours, a normal HDL subpopulation pattern had emerged and this persisted through 12 hours. After 12 hours, preβ1 HDL increased; α-1 and α-2 HDL particles slowly diminished and by 240 hours the HDL subpopulation pattern had returned to the 0 hour pattern.

References

    1. Santamarina-Fojo S, Hoeg JM, Assmann G, Brewer HB. Lecithin Cholesterol Acyltransferase Deficiency and Fish Eye Disease. In: Scriver CR, Beaudet D, Valle D, Sly WS, editors. The Metabolic & Molecular Basis of Inherited Disease. New York, NY: McGraw-Hill; 2001. pp. 2817–2833.
    1. Schwartz CC, VandenBroek JM, Cooper PS. Lipoprotein cholesteryl ester production, transfer, and output in vivo in humans. Journal of Lipid Research. 2004;45:1594–1607. - PubMed
    1. Barter PJ. Hugh sinclair lecture: the regulation and remodelling of HDL by plasma factors. Atherosclerosis Supplements. 2002;3:39–47. - PubMed
    1. Glomset JA. The plasma lecithins:cholesterol acyltransferase reaction. Journal of Lipid Research. 1968;9:155–167. - PubMed
    1. Norum K, Gjone E, Glomset JA. Familial Lecithin:cholesterol Acyltransferase Deficiency, Including Fish Eye Disease. In: Scriver CR, Beaudet AL, Sly WS, editors. The Metabolic Basis of Inherited Disease. New York, NY: McGraw-Hill; 1989. pp. 1181–1194.

Publication types

MeSH terms

Substances