. 2016 Jun 17;291(25):13014-27.
doi: 10.1074/jbc.M115.708560. Epub 2016 Apr 7.

Regulatory T Cell Modulation by CBP/EP300 Bromodomain Inhibition

Affiliations

Regulatory T Cell Modulation by CBP/EP300 Bromodomain Inhibition

Srimoyee Ghosh et al. J Biol Chem. .

Abstract

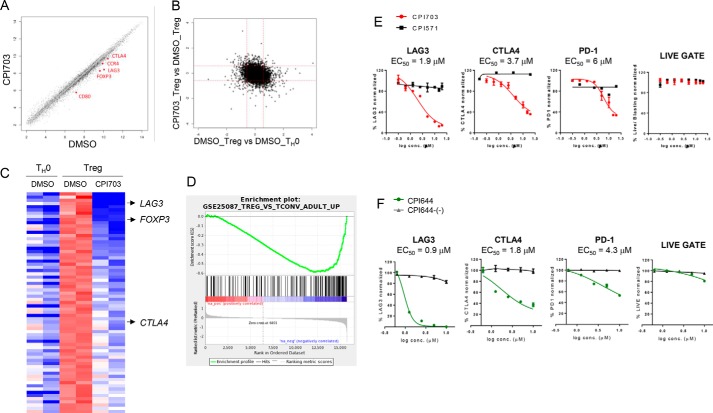
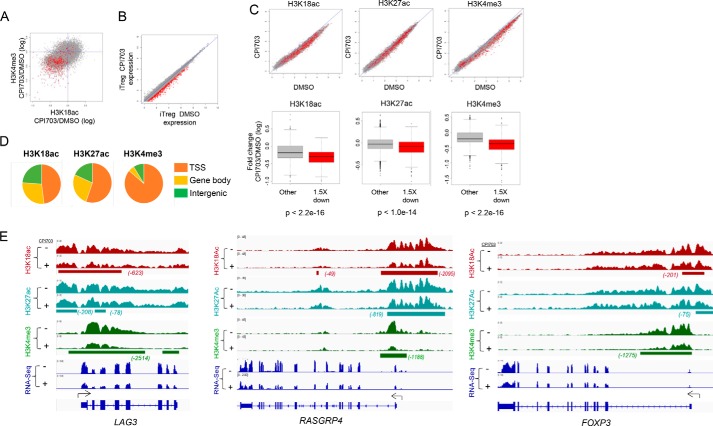
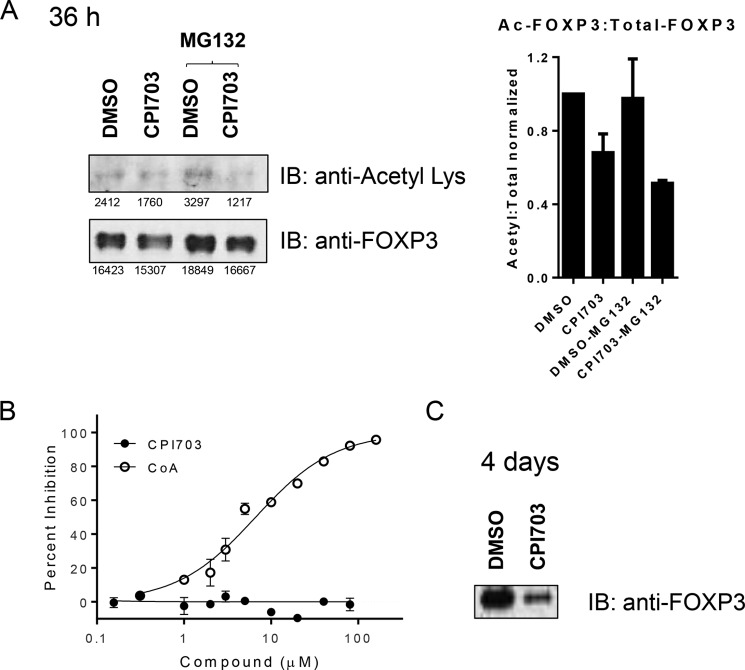
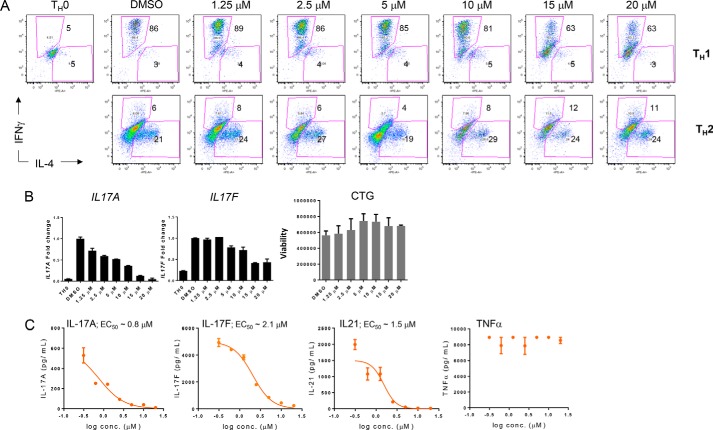
Covalent modification of histones is a fundamental mechanism of regulated gene expression in eukaryotes, and interpretation of histone modifications is an essential feature of epigenetic control. Bromodomains are specialized binding modules that interact with acetylated histones, linking chromatin recognition to gene transcription. Because of their ability to function in a domain-specific fashion, selective disruption of bromodomain:acetylated histone interactions with chemical probes serves as a powerful means for understanding biological processes regulated by these chromatin adaptors. Here we describe the discovery and characterization of potent and selective small molecule inhibitors for the bromodomains of CREBBP/EP300 that engage their target in cellular assays. We use these tools to demonstrate a critical role for CREBBP/EP300 bromodomains in regulatory T cell biology. Because regulatory T cell recruitment to tumors is a major mechanism of immune evasion by cancer cells, our data highlight the importance of CREBBP/EP300 bromodomain inhibition as a novel, small molecule-based approach for cancer immunotherapy.

Keywords: Treg, CBP, EP300, bromodomain, histone; acetylation; cellular immune response; chemical biology; chromatin regulation; forkhead box P3 (FOXP3).


Figures

FIGURE 1.
FIGURE 1.
Biochemical description and characterization of CBP/EP300 probe molecules. A, structure of CPI098 and summary table indicating potency against other bromodomains. B, CBP inhibition by CPI703 and CPI571. Representative AlphaLISA data are shown for each compound (duplicate, ± S.E.). Across multiple replicates CPI703 (closed circles) inhibits with an IC50 = 0.47 ± 0.07 μm (n = 4), and CPI571 (open circles) has an IC50 = 12.2 ± 0.4 μm (n = 3) (values ± S.E.). C, CBP inhibition by CPI644 and CPI644-(−). Representative AlphaLISA data is shown for each compound (duplicate, ± S.E.). Across multiple replicates CPI644 inhibits with IC50 = 0.18 ± 0.06 μm (n = 5) and CPI644-(−) (open circles) with IC50 = 6.0 ± 0.6 μm (n = 3) (values ± S.E.). D, ITC analysis with CPI644 or CPI644-(−) and the bromodomain of CBP. A binding stoichiometrically of n = 0.79 and a KD of 0.084 μm was observed for CPI644, although no detectable binding was observed for CPI644-(−).
FIGURE 2.
FIGURE 2.
Discovery of potent, selective, and cell-active CBP/EP300 bromodomain inhibitors. A, co-crystal structures of CPI098 (left panel) and CPI703 (right panel) with the CBP bromodomain. The compounds bind in the acetyllysine recognition site, making key hydrogen bonding interactions with Asn1168 and, through water, with Tyr1125. B, structures of CPI098, CPI703, CPI644, and CPI571. The ITC KD and AlphaLISA IC50 (AL) values are provided. C, ITC analysis of CPI703. CPI703 binds stoichiometrically with n = 0.98 and a KD of 0.35 μm. D, cellular potency of CPI703 using NanoBRET. A dose-response curve of CPI703 using the isolated CBP bromodomain and histone H3.3 with a calculated EC50 of 2.1 μm is shown. E, cellular potency of CPI703 determined by the CBP bromo dot assay. Representative images show ZsG-CBP protein aggregates at the indicated concentrations (left). The dose-dependent increase in the number and intensity of these nuclear foci was used to determine the EC50 of CPI703 (2.2 μm, right). F, cellular potency of CPI703 in an H3K18ac Mesoscale assay. The H3K18ac signal was normalized to total H3 signal, and the percentage change relative to the DMSO control was plotted. ND, not detected; DSF, differential scanning fluorimetry.
FIGURE 3.
FIGURE 3.
Cellular characterization of CBP/EP300 probe molecules. A, cellular potency of CPI644 using NanoBRET. A dose-response of CPI644 using the isolated bromodomain of CBP (top panel) or EP300 (bottom panel) and histone H3.3 with calculated EC50 values of 0.53 and 0.36 μm are shown. B, cellular potency of CPI644 determined by the CBP-bromo or BRD4 (full-length protein) dot assays. Representative images show ZsG-CBP and ZsG-BRD4 protein aggregates from 5.0 μm (CPI644 and CPI644-(−)) and 0.3 μm (CPI203) treatment (top panel). The dose-dependent increase in the number and intensity of these nuclear foci was used to determine the EC50 of CPI644 in the CBP (0.33 μm) or BRD4 (12.8 μm) dot assays (bottom panel). C, GFP (control) or Cre (knock-out) cells (25) were utilized to probe H3K18ac by Mesoscale (left panel). The relative change in H3K18ac signal was plotted setting the GFP control cells to 100%. The right panel shows a Western blot using the indicated antibodies in the GFP (control) or Cre (knock-out) cells (25). D, cellular potency of CPI703 or CPI644 using BRD4 and H3.3 NanoBRET. No appreciable inhibition was observed.
FIGURE 4.
FIGURE 4.
Pharmacological inhibition of CBP/EP300 bromodomains impairs human Treg differentiation. A, human naïve T cells were differentiated into Tregs in the presence of CPI703, the inactive analogue CPI571, or DMSO for 4 days and monitored for FOXP3 expression by flow cytometry. B, cell viability was assessed by CellTitreGlo. C, human naïve T cells were differentiated into Tregs in the presence of CPI644 or the inactive isomer CPI644-(−) and monitored for FOXP3 expression by flow cytometry on day 4. D, phenotypic recapitulation with CREBBP or EP300 shRNA-mediated knockdown. Flow cytometric analysis of transduced cultures with three independent hairpins per target (EP300 or CBP) indicated almost complete absence of FOXP3+ cells. Untransduced and non-targeting control hairpin are shown as comparison. E, human naïve T cells were differentiated into Tregs for 3 days and then treated with either CPI703 or CPI571 as indicated. FOXP3 was measured by FACS after 4 additional days. F, inhibition of Treg suppressive function by CPI703. In vitro differentiated Tregs were added to carboxyfluorescein succinimidyl ester-labeled naïve T cells at a 1:1 ratio (top); naïve T cells activated in the absence of added Tregs are shown in the bottom panel. Compounds were added at 4 μm, and proliferation was measured by FACS on day 3. The gray-shaded histograms correspond to unstimulated cells; at right, the percentage of proliferation indicates the percentage of cells undergoing one or more divisions. CFSE, carboxyfluorescein succinimidyl ester; conc., concentration; NTC, non-targeting control.
FIGURE 5.
FIGURE 5.
CBP/EP300 bromodomain inhibition alters the human Treg transcriptional signature. A and B, human naïve T cells were cultured with anti-CD3/CD28 and TGF-β/IL-2 (Treg) or anti-CD3/CD28 alone (TH0) and incubated with DMSO or 4 μm CPI703 for 4 days, and whole genome gene expression was evaluated on the Affymetrix exon array platform. Each probe set is shown as a point in the scatter plot; log fold change calculated as difference between mean values of RMA expression levels for each condition. Probe sets are shown in black if a Student's t test on the two pairs of values shows a difference with p < 0.05; otherwise the points are in gray. C, probe sets in the heat map were sorted by fold-change of transcripts in Tregs when treated with CPI703. The top row corresponds to the probe set with the greatest loss of expression with CPI703. The deepest red and blue colors represent values of +0.5 or greater, and −1.5 or less, respectively. D, the complete list of annotated probe sets along with the difference of the average RMA expression values in Tregs with CPI703 treatment versus DMSO treatment was used as input to GSEA. Gene set GSE25087_TREG_VS_TCONV_ADULT_UP showed significant down-regulation in our data set. The enrichment score was −0.5891071; the normalized enrichment score and p values were −1.8608235, and 0.0, respectively (the p value was reported by the GSEA preranked analysis program as being 0.0, based on random permutations). E and F, flow cytometric analysis for the expression of the indicated markers on Tregs treated with CPI703 (and CPI571) (E) and CPI644 (and CPI644-(−)) (F). conc., concentration.
FIGURE 6.
FIGURE 6.
CBP/EP300 bromodomain inhibition alters the chromatin state and reduces H3K18Ac and H3K27Ac at key target loci in human Tregs. A, each point in the scatter plot represents the regularized log2 fold change with treatment (CPI703 versus DMSO) of average ChIP-seq signal at a transcript start site for the given signal (H3K18ac on the x axis and H3K4me3 on the y axis). Points in red represent transcripts showing a loss of expression, as defined by a regularized log2 fold change of at least 1.5 down. B, each point in the scatter plot shows the regularized log expression level of one transcript for CPI703 versus DMSO treatment. Points in red represent transcripts showing a loss of expression, as defined by a regularized log2 fold change of at least 1.5 down. C, scatter plots in the top row show the effect of CPI703 versus DMSO on histone mark signals near TSSs. Each point is one TSS, and red points represent transcripts showing an expression loss of at least 1.5 in regularized log2 space. The box and whiskers plots in the bottom row summarize the change in regularized log2 histone mark ChIP-seq signal for down-regulated (red) and other (gray) transcripts; p values from Student's t test comparing mark changes for down-regulated versus other transcripts. D, fraction of ChIP-seq signal in different genomic regions. SICER version 1.1 was run to identify regions of occupancy. All SICER intervals within 1000 bp of a TSS were annotated as TSS. SICER intervals overlapping the gene body but not TSS were annotated as gene body binding. All other SICER intervals were annotated as intergenic. Total SICER-reported signal in the intervals was summed for each category and summarized in this figure. E, visualization in IGV of ChIP-seq signal at the LAG3, RASGRP4, and FOXP3 loci. Intervals of differential occupancy are shown beneath each pair of treated and control tracks.
FIGURE 7.
FIGURE 7.
CBP/EP300 bromodomain inhibition modulates FOXP3 acetylation. A, human Tregs were differentiated in the presence of 4 μm CPI703 for 36 h. FOXP3 was immunoprecipitated using anti-Foxp3 magnetic beads and immunoblotted with a pan-acetyl Lys antibody or anti-Foxp3. MG132 was added to reduce proteasome-induced FOXP3 degradation. Quantification for each band is indicated below, and the ratio of acetylated to total FOXP3 is shown in the right panel (average of three independent experiments). B, acetyltransferase assay using full-length EP300 HAT. In the same experiment the reaction product CoA inhibited with IC50 6.2 ± 1.2 μm (+S.E.). The data are the averages of two replicates ± S.E. C, human Tregs where differentiated as in A, for 4 days, and FOXP3 immunoprecipitated as in A and immunoblotted with anti-Foxp3. IB, immunoblotting.
FIGURE 8.
FIGURE 8.
CBP/EP300 bromodomain inhibition does not affect TH1 and TH2 differentiation while strongly suppressing cytokine production by TH17 cells. A, human naïve T cells were differentiated under TH1 or TH2 conditions for 7 days, rested for 2 days, restimulated with PMI/ionomycin for 5 h, and analyzed by flow cytometry. B, human naïve T cells were differentiated under TH17 conditions for 4 days, RNA was isolated and analyzed by qPCR for the indicated transcripts, and cell viability was assessed by CellTitreGlo. C, human naïve T cells were differentiated under TH17 conditions for 7 days, and the culture media were analyzed by Luminex for the indicated analytes. conc., concentration.

References

    1. Sakaguchi S., Ono M., Setoguchi R., Yagi H., Hori S., Fehervari Z., Shimizu J., Takahashi T., and Nomura T. (2006) Foxp3+ CD25+ CD4+ natural regulatory T cells in dominant self-tolerance and autoimmune disease. Immunol. Rev. 212, 8–27 - PubMed
    1. Zheng Y., and Rudensky A. Y. (2007) Foxp3 in control of the regulatory T cell lineage. Nat. Immunol. 8, 457–462 - PubMed
    1. Savage P. A., Malchow S., and Leventhal D. S. (2013) Basic principles of tumor-associated regulatory T cell biology. Trends Immunol. 34, 33–40 - PMC - PubMed
    1. Sugiyama D., Nishikawa H., Maeda Y., Nishioka M., Tanemura A., Katayama I., Ezoe S., Kanakura Y., Sato E., Fukumori Y., Karbach J., Jäger E., and Sakaguchi S. (2013) Anti-CCR4 mAb selectively depletes effector-type FoxP3+CD4+ regulatory T cells, evoking antitumor immune responses in humans. Proc. Natl. Acad. Sci. U.S.A. 110, 17945–17950 - PMC - PubMed
    1. Curiel T. J., Coukos G., Zou L., Alvarez X., Cheng P., Mottram P., Evdemon-Hogan M., Conejo-Garcia J. R., Zhang L., Burow M., Zhu Y., Wei S., Kryczek I., Daniel B., Gordon A., Myers L., Lackner A., Disis M. L., Knutson K. L., Chen L., and Zou W. (2004) Specific recruitment of regulatory T cells in ovarian carcinoma fosters immune privilege and predicts reduced survival. Nat. Med. 10, 942–949 - PubMed

MeSH terms