. 2016 Jun 3;291(23):12233-44.
doi: 10.1074/jbc.M116.720656. Epub 2016 Apr 7.

Distinct Membrane Disruption Pathways Are Induced by 40-Residue β-Amyloid Peptides

Affiliations

Distinct Membrane Disruption Pathways Are Induced by 40-Residue β-Amyloid Peptides

Dennis A Delgado et al. J Biol Chem. .

Abstract

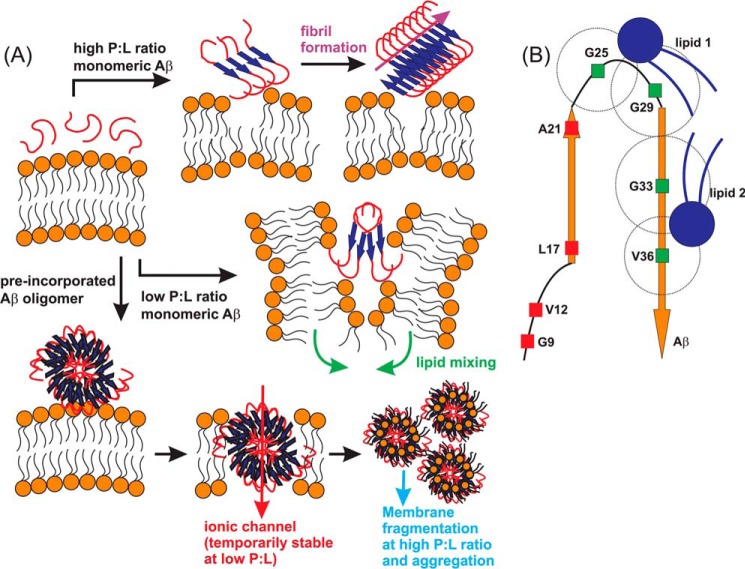
Cellular membrane disruption induced by β-amyloid (Aβ) peptides has been considered one of the major pathological mechanisms for Alzheimer disease. Mechanistic studies of the membrane disruption process at a high-resolution level, on the other hand, are hindered by the co-existence of multiple possible pathways, even in simplified model systems such as the phospholipid liposome. Therefore, separation of these pathways is crucial to achieve an in-depth understanding of the Aβ-induced membrane disruption process. This study, which utilized a combination of multiple biophysical techniques, shows that the peptide-to-lipid (P:L) molar ratio is an important factor that regulates the selection of dominant membrane disruption pathways in the presence of 40-residue Aβ peptides in liposomes. Three distinct pathways (fibrillation with membrane content leakage, vesicle fusion, and lipid uptake through a temporarily stable ionic channel) become dominant in model liposome systems under specific conditions. These individual systems are characterized by both the initial states of Aβ peptides and the P:L molar ratio. Our results demonstrated the possibility to generate simplified Aβ-membrane model systems with a homogeneous membrane disruption pathway, which will benefit high-resolution mechanistic studies in the future. Fundamentally, the possibility of pathway selection controlled by P:L suggests that the driving forces for Aβ aggregation and Aβ-membrane interactions may be similar at the molecular level.

Keywords: Alzheimer disease; NMR; amyloid β; ion channel; liposome; membrane.


Figures

FIGURE 1.
FIGURE 1.
Analytical HPLC of residual 40-residue Aβ in supernatants. A, HPLC chromatographs for the external addition and preincorporation samples with different P:L ratios. The Aβ eluted at ∼22 min. The dashed HPLC profile shown in the top left panel represents the blank without Aβ. The minor peak at ∼21 min was identified (using mass spectrometry) as the truncated Aβ impurity. B, plot of the residual Aβ (Ab) concentrations in the supernatant of external addition (sample index: 1, P:L = 1:30; 2, 1:60; 3, 1:90; 4, 1:120) and preincorporation (sample index: 5, 1:30; 6, 1:60; 7, 1:90; 8, 1:120) samples, calculated from the standard curve of freshly dissolved Aβ peptide. Error bars were determined from three independent runs. C, calibration curve from the freshly dissolved Aβ (with a concentration range from 1.5–30 μm) with a sample HPLC profile (30 μm) shown in the inset (x axis, elution time in minutes; y axis, intensity at 214 nm). Error bars were determined from three independent runs. a.u., arbitrary unit.
FIGURE 2.
FIGURE 2.
CD and fluorescence spectra for Aβ-liposome samples. Samples with different P:L ratios are color-coded in a uniform way for all panels (black, 1:30; red, 1:60; blue, 1:90; purple, 1:120). A and B, CD spectra for external addition (with 4-h incubation) (A) and preincorporation samples (with 4- and 24-h incubation) (B). Control spectra with liposomes in the absence of Aβ were subtracted from the corresponding Aβ-liposome samples. C and D, membrane content leakage traces from time-dependent calcein fluorescence emissions for external addition (C) and preincorporation (D) samples. All spectra were recorded with excitation and emission wavelengths at 485 and 520 nm, respectively. E, ThT fluorescence measurements on fibrillation kinetics for the preincorporation samples. Similar measurements for the external addition samples have been reported previously. Excitation and Emission wavelengths were set to 430 and 490 nm, respectively. F, lipid mixing assay on vesicle fusion for the preincorporation samples. Similar measurements for the external addition samples have been reported before. Excitation and Emission wavelengths were set to 480 and 585 nm, respectively. a.u., arbitrary unit.
FIGURE 3.
FIGURE 3.
31P solid-state NMR measurements for preincorporation Aβ-liposome samples. A, static 31P NMR spectra collected at 1- (black), 4- (red), and 24-h (blue) incubation times for samples with different P:L ratios. Isotropic peaks were observed at ∼5 ppm for the sample with P:L ratios of 1:30 and 1:60 but less significantly for samples with P:L ratios of 1:90 and 1:120. B, plots of 31P T2 relaxation curves versus incubation time (1, 4, and 24 h). A faster relaxation rate was observed for 1:30 and 1:60 samples at a 4-h incubation period. All experimental data sets fit reasonably well to single exponential decay curves.
FIGURE 4.
FIGURE 4.
Confocal fluorescence imaging for Aβ-liposome samples. A, representative confocal imaging for rhodamine B-labeled (red channel only) liposomes in the external addition giant unilamellar vesicle samples and the distribution of vesicle sizes after 48-h incubation. The histograms for the control (without peptide) and the sample with 1:30 P:L ratio and 1:120 P:L ratio are shown in the top left, center left, and bottom left panels, respectively. The arrows highlighted non-spherical species that indicate fusion between individual vesicles. B, representative confocal imaging for rhodamine B-labeled (red channel) liposomes and rhodamine green-labeled (green channel) 40-residue Aβ peptides in the preincorporation large unilamellar vesicle samples with a P:L ratio of 1:30 (left panels) and 1:120 (right panels). The white dotted contours highlight the morphologies of aggregates, and the arrows highlight spherical vesicles only composed of lipids (lack of green channel signal at the same locations). Scale bars = 5 μm.
FIGURE 5.
FIGURE 5.
A–D, 13C,31P REDOR measurements on the preincorporation sample with a P:L ratio of 1:30. For each labeled sequence, pairs of representative S0/S1 REDOR spectra at 17.8 and 23.8 ms dephasing times. Each spectrum shows a doublet where the right-side peak represents Gly C' and the left-side peak is from the C' of the second type of amino acid (i.e. Val/Leu/Ala). E–H, the experimental REDOR dephasing (i.e. ΔS = (S0-S1)/S0) was calculated by integrating over a 1-ppm range around the corresponding S0 and S1 peaks. Shown is fitting of the experimental ΔS versus REDOR dephasing time to a single 13C,31P spin pair using SIMPSON. For each set of experimental data, the best fit 13C,31P dipolar coupling frequency (fopt) and the standard deviation (χ2min) are shown. The best fit 13C,31P distances (r) were calculated using the relationship r = (12,250/fopt)1/3.
FIGURE 6.
FIGURE 6.
Electronic current traces for the preincorporation samples. Each panel contains a 1-min current trace that is ∼10 min after the data collection and a 3-s expanded region that highlights the signal. A, freshly prepared sample with a P:L ratio of 1:120. B, the same sample as in A but after 48-h incubation at 37 °C. C, cross-linked sample with a P:L ratio of 1:120 and after 48-h incubation at 37 °C. D, freshly prepared sample with a P:L ratio of 1:30.
FIGURE 7.
FIGURE 7.
A, proposed membrane interaction pathways under different conditions of initial Aβ oligomeric states and P:L molar ratio. Fibrillation and vesicle fusion are induced by membrane interactions of monomeric or small oligomeric Aβ peptides. Membrane fragmentation and Aβ-lipid aggregates are induced by membrane interactions of preformed large Aβ oligomers, with the possibility of forming ionic channels. B, schematic of binding between Aβ and lipids in the Aβ-lipid aggregates based on solid-state NMR measurements. A possible binding model between Aβ and phospholipids, derived from solid-state NMR 13C,31P REDOR experiments. The best fit distances for four specific residues, Gly-25, Gly-29, Gly-33, and Val-36, are shown with dashed circles, which indicate the possible binding sites of phospholipids. At least two binding sites are required to fulfill the experimental results. The schematic is drawn in scale.

References

    1. Chiti F., and Dobson C. M. (2006) Protein misfolding, functional amyloid, and human disease. Annu. Rev. Biochem. 75, 333–366 - PubMed
    1. Chiang P. K., Lam M. A., and Luo Y. (2008) The many faces of amyloid β in Alzheimer's disease. Curr. Mol. Med. 8, 580–584 - PubMed
    1. Eckert G. P., Wood W. G., and Müller W. E. (2010) Lipid membranes and β-amyloid: a harmful connection. Curr. Protein Pept. Sci. 11, 319–325 - PubMed
    1. Butterfield S. M., and Lashuel H. A. (2010) Amyloidogenic protein-membrane interactions: mechanistic insight from model systems. Angew. Chem. Int. Ed. Engl. 49, 5628–5654 - PubMed
    1. Mason R. P., Estermyer J. D., Kelly J. F., and Mason P. E. (1996) Alzheimer's disease amyloid β peptide 25–35 is localized in the membrane hydrophobic core: x-ray diffraction analysis. Biochem. Biophys. Res. Comm. 222, 78–82 - PubMed

Publication types

MeSH terms