. 2016 May 27;291(22):11876-86.
doi: 10.1074/jbc.M116.723577. Epub 2016 Apr 7.

Mapping of the Allosteric Site in Cholesterol Hydroxylase CYP46A1 for Efavirenz, a Drug That Stimulates Enzyme Activity

Affiliations

Mapping of the Allosteric Site in Cholesterol Hydroxylase CYP46A1 for Efavirenz, a Drug That Stimulates Enzyme Activity

Kyle W Anderson et al. J Biol Chem. .

Abstract

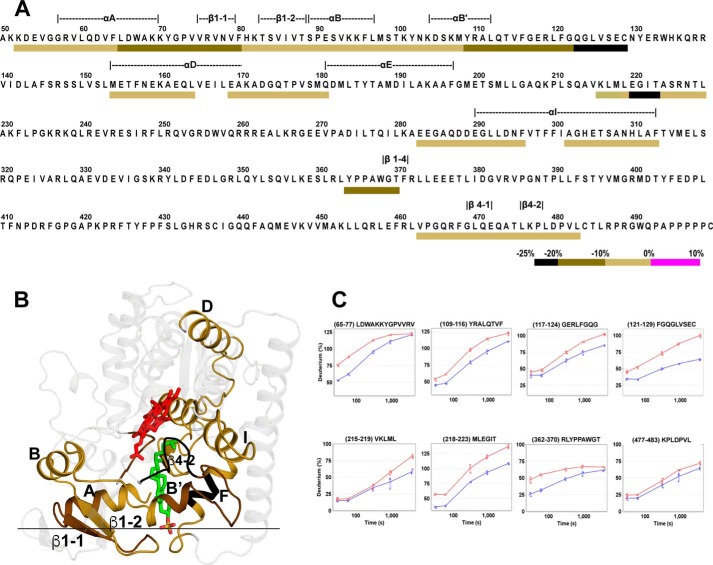
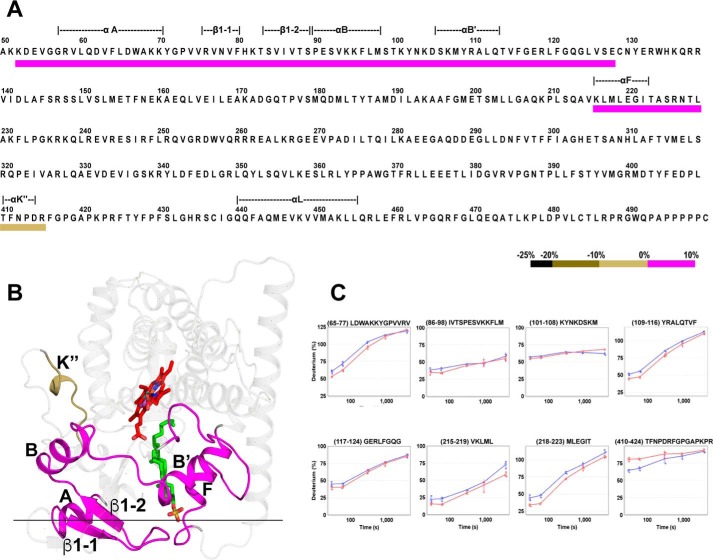
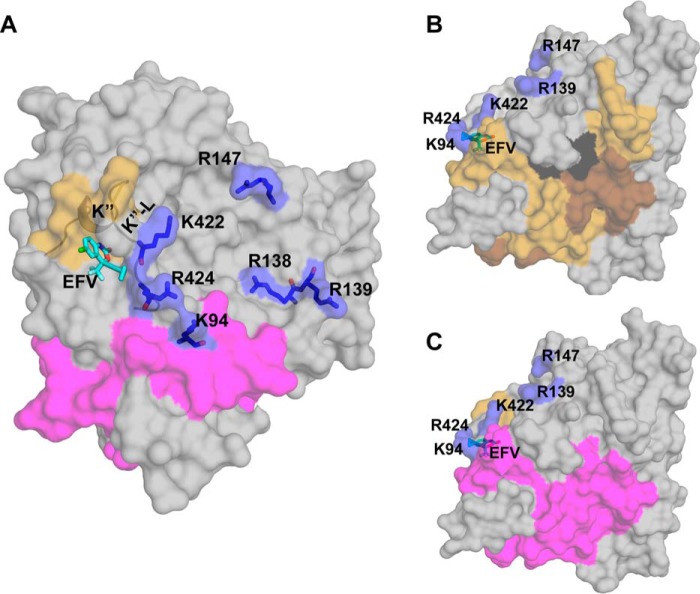
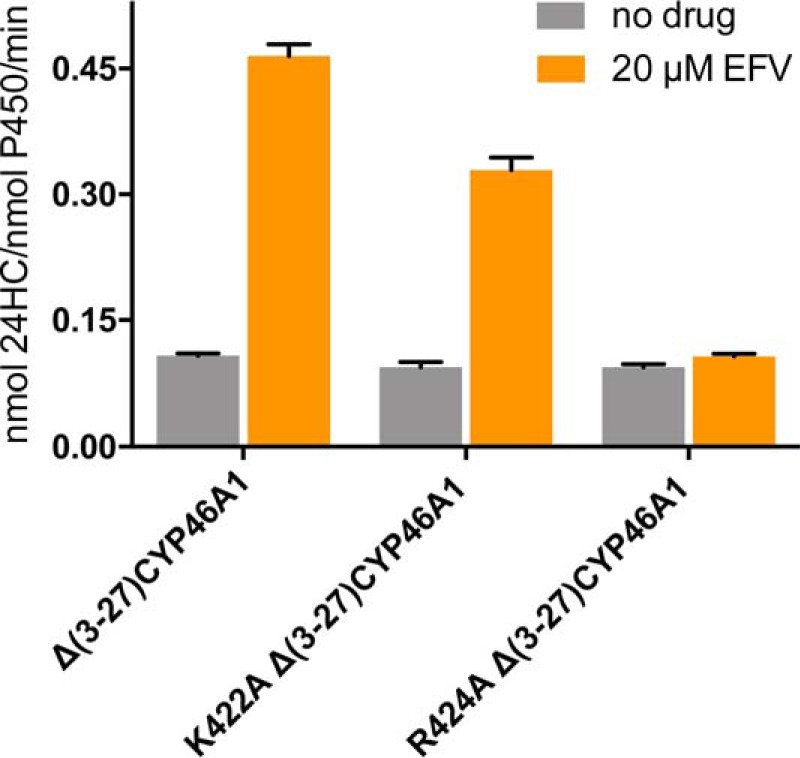
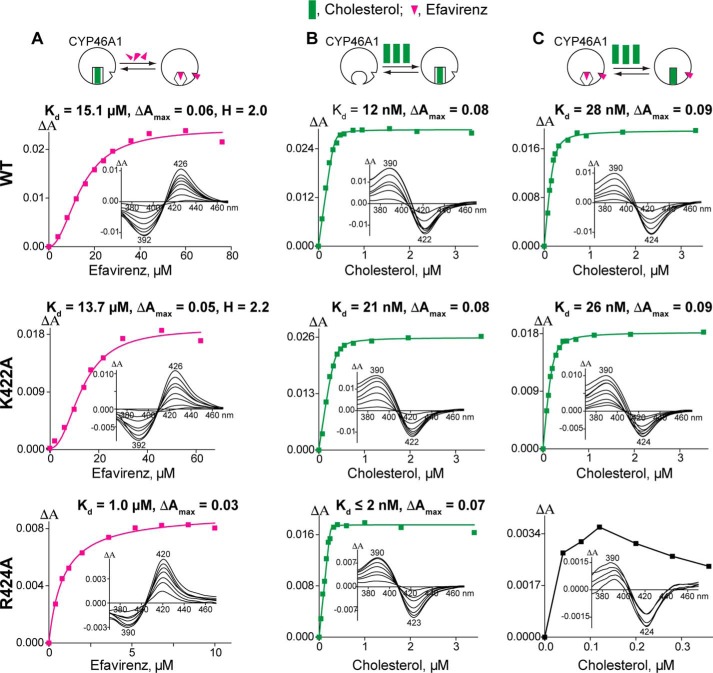
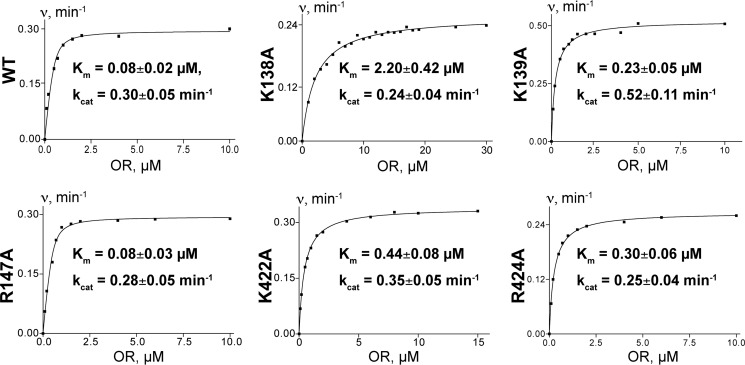
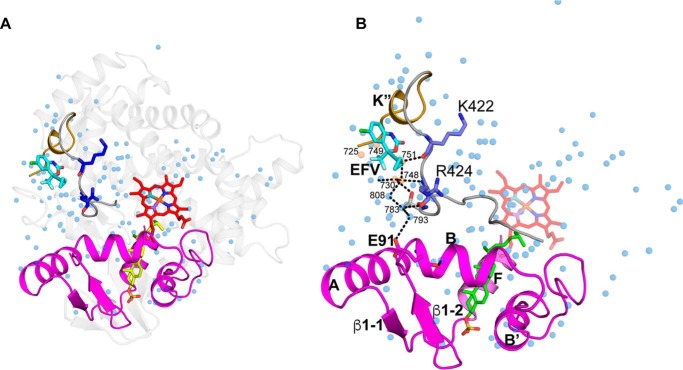
Cytochrome P450 46A1 (CYP46A1) is a microsomal enzyme and cholesterol 24-hydroxylase that controls cholesterol elimination from the brain. This P450 is also a potential target for Alzheimer disease because it can be activated pharmacologically by some marketed drugs, as exemplified by efavirenz, the anti-HIV medication. Previously, we suggested that pharmaceuticals activate CYP46A1 allosterically through binding to a site on the cytosolic protein surface, which is different from the enzyme active site facing the membrane. Here we identified this allosteric site for efavirenz on CYP46A1 by using a combination of hydrogen-deuterium exchange coupled to MS, computational modeling, site-directed mutagenesis, and analysis of the CYP46A1 crystal structure. We also mapped the binding region for the CYP46A1 redox partner oxidoreductase and found that the allosteric and redox partner binding sites share a common border. On the basis of the data obtained, we propose the mechanism of CYP46A1 allostery and the pathway for the signal transmission from the P450 allosteric site to the active site.

Keywords: Alzheimer disease; allosteric regulation; brain; cholesterol; cholesterol metabolism; cytochrome P450; drug design; hydrogen-deuterium exchange.


Figures

FIGURE 1.
FIGURE 1.
Dependence of enzyme activity on EFV concentrations in the in vitro enzyme assay utilizing purified CYP46A1. The assay conditions are described under “Experimental Procedures.” The results are mean ± S.D. of the measurements in three independent experiments. FL, full-length CYP46A1; Δ(3–27)CYP46A1 and Δ(2–50)CYP46A1, two CYP46A1 truncated forms.
FIGURE 2.
FIGURE 2.
Differential HDX analysis for the CYP46A1 complex with cholesterol versus substrate-free CYP46A1. A, colored bar mapping of the consolidated regions with altered deuterium uptake in the CYP46A1 primary sequence. Only negative ΔD% values were found, as indicated by the black, dark olive, and light olive bars below the primary CYP46A1 sequence according to the color code shown at the bottom. The dashed lines above the primary P450 sequence indicate the CYP46A1 secondary structural elements. B, mapping of the regions with altered deuterium uptake on the CYP46A1 crystal structure (PDB code 2Q9F). The heme is shown in red and cholesterol sulfate in green. The nitrogen, oxygen, and sulfate atoms are shown in blue, red, and yellow, respectively. The black horizontal line separates the cytosolic (above) and membrane-associated (below) portions of CYP46A1. C, kinetics of deuterium incorporation in eight representative peptides from the CYP46A1 regions that showed significant differences between cholesterol-bound CYP46A1 (blue) versus substrate-free CYP46A1 (red). The results are mean ± S.D. of triplicate measurements.
FIGURE 3.
FIGURE 3.
Differential HDX analysis for the CYP46A1 double complex with EFV and cholesterol versus the CYP46A1 complex with cholesterol. A, colored bar mapping of the consolidated regions with altered deuterium uptake in the CYP46A1 primary sequence. The color code is shown at the bottom. The dashed lines above the CYP46A1 primary sequence indicate the protein secondary structural elements. B, mapping of the regions with altered deuterium uptake on the CYP46A1 crystal structure (PDB code 2Q9F). Coloring of the atoms is as in Fig. 2. The black horizontal line separates the cytosolic (above) and membrane-associated (below) portions of CYP46A1. C, kinetics of deuterium incorporation in eight representative peptides from the CYP46A1 regions that showed significant differences between the CYP46A1 double complex with EFV and cholesterol (blue) versus the CYP46A1 complex with cholesterol (red). The results are mean ± S.D. of triplicate measurements.
FIGURE 4.
FIGURE 4.
Views of surface representation of the CYP46A1 structure (PDB code 2Q9F) with the docked EFV. EFV is shown in cyan, and the side chains and surface of the positively charged resides with potential for EFV and/or OR binding are shown in blue. The nitrogen, oxygen, fluorine, and chlorine atoms are shown in blue, red, light cyan, and green, respectively. A, close proximity in CYP46A1 of the putative EFV- and cytochrome P450 oxidoreductase-binding sites. The peptide coloring is the same as in Fig. 3. B and C, spatial positioning of the putative EFV- and oxidoreductase-binding sites relative to the regions with altered deuterium uptake in the CYP46A1 complex with cholesterol versus substrate-free CYP46A1 and the CYP46A1 double complex with EFV and cholesterol versus the CYP46A1 complex with cholesterol, respectively. The CYP46A1 orientation and peptide coloring are the same as in Figs. 2B and 3B.
FIGURE 5.
FIGURE 5.
Effects of mutations on CYP46A1 activation by EFV in the in vitro enzyme assay. Both Δ(3–27)CYP46A1 and the K422A mutant are activated by EFV. However, the R424A mutation abolishes P450 activation by EFV. The assay conditions are described under “Experimental Procedures.” The results are mean ± S.D. of the measurements in three independent experiments.
FIGURE 6.
FIGURE 6.
Effect of CYP46A1 mutations on EFV and cholesterol binding as assessed by spectral assays. The top of each vertical panel shows a schematic of the assay conditions: circles for CYP46A1, green rectangles for cholesterol, and magenta triangles for EFV. Each panel also shows the spectral parameters of binding (mean of triplicate experiments, S.D. ≤ 20% of a mean value and not shown), representative binding curve for the titrating ligand, and ligand-induced P450 difference spectra (insets) indicating the positions of the spectral peaks and troughs. A, EFV titrations of CYP46A1 in the presence of 20 μm cholesterol. B, cholesterol titrations of substrate-free CYP46A1. C, cholesterol titrations of CYP46A1 in the presence of 20 μm EFV. The assay conditions are described under “Experimental Procedures.” The spectral Kd values in B and C are estimates only because cholesterol and EFV bind very tightly, with the apparent Kd values being much lower than the concentration of CYP46A1 (0.4 μm). The Kd of cholesterol for the R424A mutant in the presence of EFV was not determined because of the weak P450 spectral response.
FIGURE 7.
FIGURE 7.
Effect of CYP46A1 mutations on kinetic parameters of the CYP46A1-cytochrome P450 OR complex. Each panel shows a representative kinetic curve and mean ± S.D. of the kinetic parameters, which represent the measurements in three independent experiments. The assay conditions are described under “Experimental Procedures.”
FIGURE 8.
FIGURE 8.
Cartoon representation of the crystal structure of substrate-bound CYP46A1 (PDB code 2Q9F). A, the distribution of crystallographic water molecules (blue spheres). B, putative amino acid residues and water molecules involved in signal transmission from the allosteric site to the P450 active site. Water molecules in EFV-binding site are colored in wheat. The color code is the same as in Fig. 4. Black dashed lines indicate hydrogen bonds.

References

    1. Lütjohann D., Breuer O., Ahlborg G., Nennesmo I., Sidén A., Diczfalusy U., and Björkhem I. (1996) Cholesterol homeostasis in human brain: evidence for an age-dependent flux of 24s-hydroxycholesterol from the brain into the circulation. Proc. Natl. Acad. Sci. U.S.A. 93, 9799–9804 - PMC - PubMed
    1. Lund E. G., Guileyardo J. M., and Russell D. W. (1999) cDNA cloning of cholesterol 24-hydroxylase, a mediator of cholesterol homeostasis in the brain. Proc. Natl. Acad. Sci. U.S.A. 96, 7238–7243 - PMC - PubMed
    1. Björkhem I., Lütjohann D., Diczfalusy U., Ståhle L., Ahlborg G., and Wahren J. (1998) cholesterol homeostasis in human brain: turnover of 24s-hydroxycholesterol and evidence for a cerebral origin of most of this oxysterol in the circulation. J. Lipid Res. 39, 1594–1600 - PubMed
    1. Lund E. G., Xie C., Kotti T., Turley S. D., Dietschy J. M., and Russell D. W. (2003) Knockout of the cholesterol 24-hydroxylase gene in mice reveals a brain-specific mechanism of cholesterol turnover. J. Biol. Chem. 278, 22980–22988 - PubMed
    1. Kotti T. J., Ramirez D. M., Pfeiffer B. E., Huber K. M., and Russell D. W. (2006) Brain cholesterol turnover required for geranylgeraniol production and learning in mice. Proc. Natl. Acad. Sci. U.S.A. 103, 3869–3874 - PMC - PubMed

Publication types

Associated data