. 2016 Oct;73(19):3719-31.
doi: 10.1007/s00018-016-2213-2. Epub 2016 Apr 7.

Dominant negative SNARE peptides stabilize the fusion pore in a narrow, release-unproductive state

Affiliations

Dominant negative SNARE peptides stabilize the fusion pore in a narrow, release-unproductive state

Alenka Guček et al. Cell Mol Life Sci. 2016 Oct.

Abstract

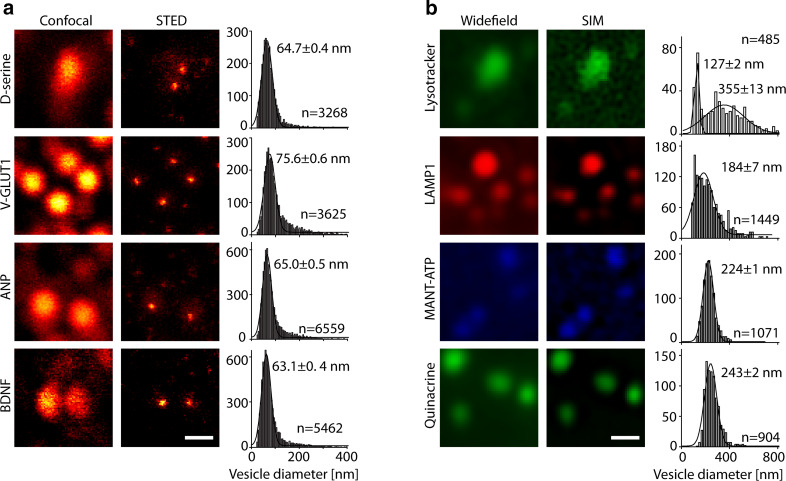
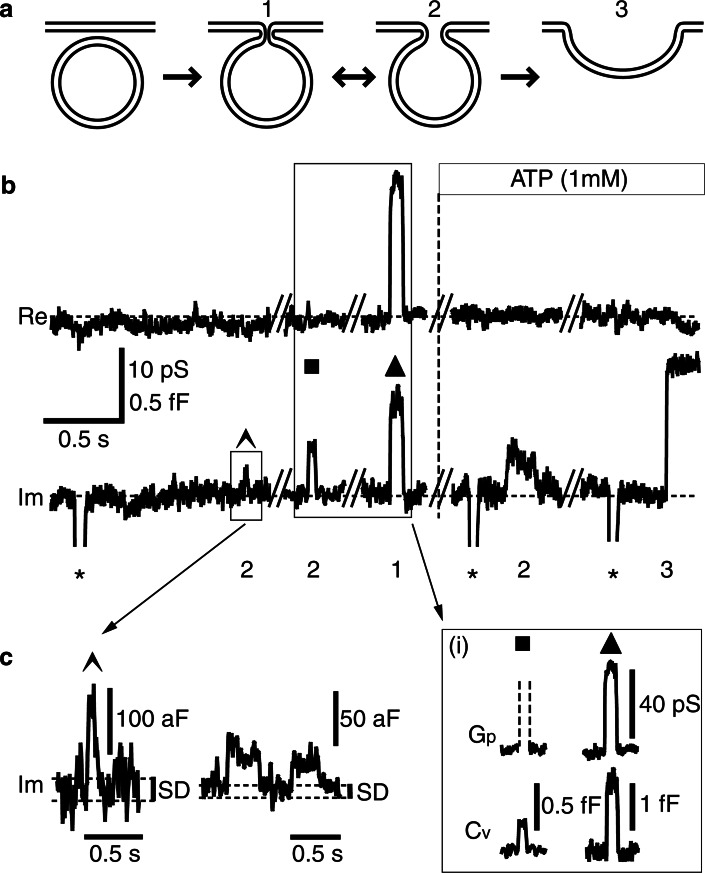
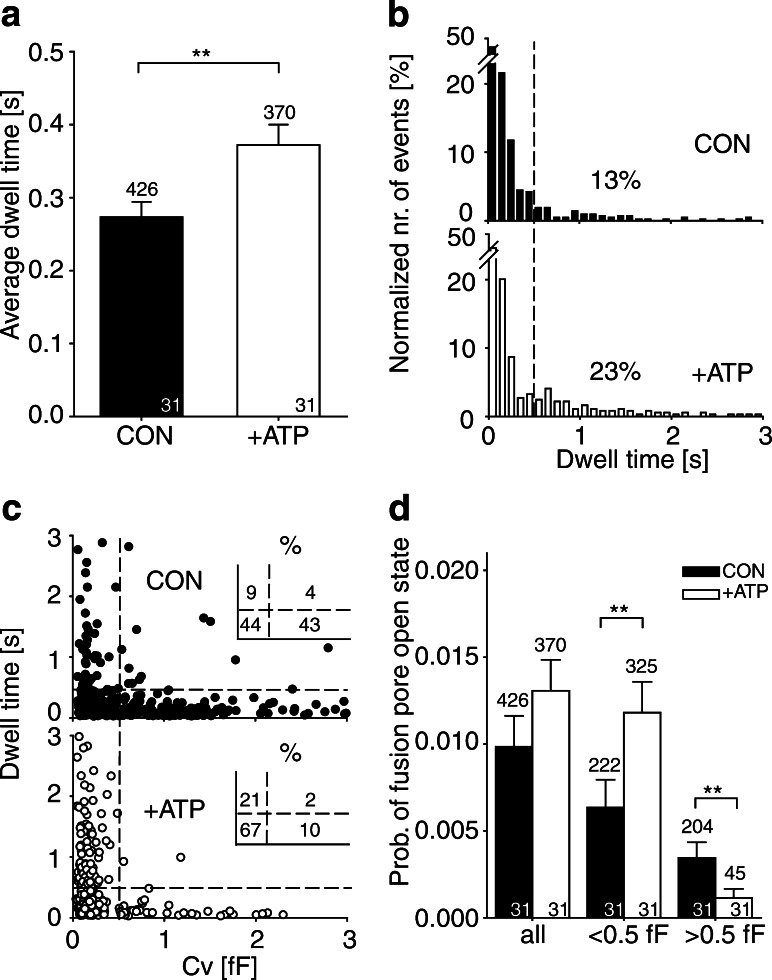
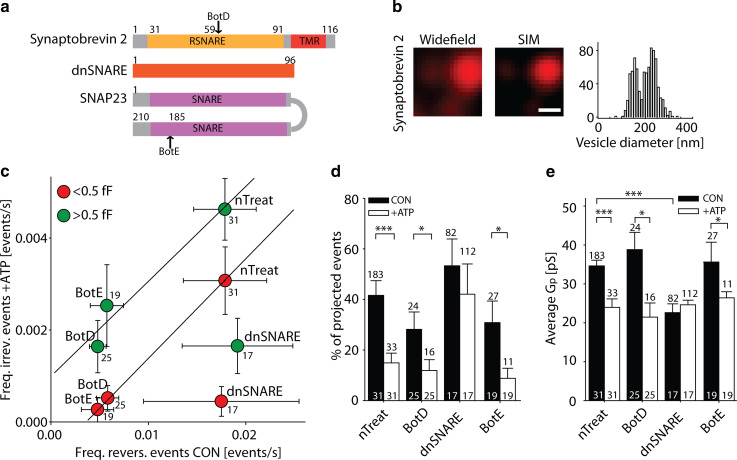
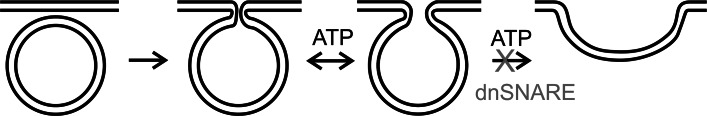
Key support for vesicle-based release of gliotransmitters comes from studies of transgenic mice with astrocyte-specific expression of a dominant-negative domain of synaptobrevin 2 protein (dnSNARE). To determine how this peptide affects exocytosis, we used super-resolution stimulated emission depletion microscopy and structured illumination microscopy to study the anatomy of single vesicles in astrocytes. Smaller vesicles contained amino acid and peptidergic transmitters and larger vesicles contained ATP. Discrete increases in membrane capacitance, indicating single-vesicle fusion, revealed that astrocyte stimulation increases the frequency of predominantly transient fusion events in smaller vesicles, whereas larger vesicles transitioned to full fusion. To determine whether this reflects a lower density of SNARE proteins in larger vesicles, we treated astrocytes with botulinum neurotoxins D and E, which reduced exocytotic events of both vesicle types. dnSNARE peptide stabilized the fusion-pore diameter to narrow, release-unproductive diameters in both vesicle types, regardless of vesicle diameter.

Keywords: Astrocytes; Capacitance measurements; Fusion pore; Gliotransmitters; Regulated exocytosis; STED microscopy.


Figures

Fig. 1
Fig. 1
Gliosignal vesicles studied by super-resolution STED microscopy and SIM. a Confocal and STED images of vesicles containing amino acids d-serine and glutamate (immunostained with antibody against V-GLUT1) and peptides ANP and BDNF. Histograms on the right show distributions of STED-acquired vesicle diameters (n = 4 cells per staining, from two different cultures). The curves show vesicle diameter distributions fitted with the Gaussian curve; numbers adjacent to the distribution peaks indicate the vesicle diameter (mean ± SEM), n number of vesicles. Scale bar 500 nm. b Wide-field and SIM images of acidic vesicles stained with LysoTracker, endolysosomal vesicles immunostained with LAMP1 antibodies, and vesicles loaded with the ATP analogue MANT-ATP and the ATP marker quinacrine dihydrochloride. Histograms on the right show distributions of SIM-acquired vesicle diameters. The curves are Gaussian fits of the diameter distributions with vesicle diameter (mean ± SEM) labeled adjacent to the distribution peaks. Scale bar 500 nm
Fig. 2
Fig. 2
Unitary exocytotic events in astrocytes. a Stages of regulated exocytosis. After docking, the vesicle fuses with the plasmalemma, which leads to the establishment of a narrow fusion pore (stage 1). Once formed, the fusion pore may widen reversibly (stage 2), or merge completely with the plasmalemma (stage 3). b Representative discrete steps in membrane capacitance (C m). The top trace shows the real (Re) part of the admittance signals and the bottom trace shows the imaginary part (Im; proportional to C m) before (control) and after ATP stimulation. In controls, the Im trace shows two types of exocytotic events: reversible events (a discrete on-step followed by an off-step of similar amplitude in C m, events marked 2) and reversible events exhibiting projections to Re (event marked 1). After ATP, reversible events at <0.5 fF persisted (events marked 2), and events at >0.5 fF preferentially exhibited full fusion characteristics (event marked 3). C v and G p can be estimated in events marked 1 [see “Materials and methods” and the event marked with a triangle in (i)]. However, G p is undetectable for events marked 2 [the event marked with a square in (i)]. Asterisks denote the calibration pulses; numbers denote exocytotic stages (as in a). c To ascertain that a discrete step in C m is not due to noise, a step was considered to be discrete when the amplitude was ≥3 times larger than the standard deviation of the noise. The event marked by the arrowhead had an amplitude of 0.17 fF (noise level 0.038 fF). On the right, two reversible events from a different recording had amplitudes of 0.055 fF and 0.039 fF (noise level 0.013 fF)
Fig. 3
Fig. 3
Amplitudes and frequencies of exocytotic events in astrocytes. a The C v amplitude distributions of reversible exocytotic events exhibit bimodal distribution in controls (n = 426, black bars), but not after ATP stimulation (+ATP, n = 370, white bars). Note the increase in <0.5 fF events (to 74 % from 48 %) and a decrease in >0.5 fF events (to 10 % from 42 %) after ATP. The percentages were estimated by taking into account all reversible and irreversible events recorded (n = 477 for control; n = 440 after ATP). b The C v amplitude distributions of irreversible events in controls (n = 51, black bars) and after ATP (n = 70, white bars) show that the percentage of irreversible events at >0.5 fF increased threefold (to 5.5 % from 1.7 %) after ATP. c After ATP stimulation, the frequency of all reversible exocytotic events was unchanged (P = 0.54); however, the frequency of reversible events <0.5 fF increased (P = 0.006 vs. controls), whereas the frequency of events >0.5 fF decreased (P = 0.003). d The frequency of irreversible exocytotic events increased after ATP (white bars) compared with controls (black bars, P = 0.006). This increase is mainly due to the increased frequency of events at >0.5 fF (P = 0.013), as the frequency of events at <0.5 fF was unchanged (P = 0.16). e The C v amplitude distributions of reversible events in acutely isolated astrocytes in controls (black bars) and after ATP (white bars). The difference in the occurrence of events at <0.5 fF and at >0.5 fF was similar to that in cultured astrocytes. The percentages as in a (n = 406 control; n = 379 ATP). f The frequency of reversible events in controls (black bars) and after ATP (white bars) was significantly lower than in nontreated astrocytes (withCa) in noCa ECS (P < 0.001) or after application of a chelator, BAPTA (P < 0.001). Vehicle for BAPTA (DMSO in noCa): P = 0.60 and P = 0.17, respectively. The numbers above the error bars are the numbers of events recorded; the numbers at the bottom of the bars are the numbers of cells analyzed
Fig. 4
Fig. 4
ATP-mediated fusion-pore widening. a The percentage of reversible exocytotic events displaying cross-talk between Im and Re (proj., 31 cells) for controls (black bars) is similar to the percentage of control events devoid of such projections (non-proj., P = 0.22). Stimulation with ATP (white bars) reduced the percentage of projected reversible events by 75 % vs. controls (P < 0.001). Consequently, the percentage of nonprojected reversible events increased significantly (P = 0.002). b The average fusion-pore conductance (G p) of reversible projected exocytotic events was lower after ATP (white bar, P < 0.001) than in controls (black bar). c Distribution of vesicle diameter (lower abscissa) and fusion-pore diameter (left ordinate) in controls (CON, n = 183). Higher frequencies are marked with darker gray. The top abscissa denotes vesicle capacitance (C v) and the right ordinate denotes G p. d Distribution of vesicle and fusion-pore diameters after ATP (n = 33). Higher frequencies are marked with darker grey. Matching C v abscissa on the top and G p ordinate on the right scales are added. In comparison with c, note that most of the data are clustered around vesicles with a diameter of ~200 nm and a fusion-pore diameter of ~0.5 nm (significant difference compared to c in x: P < 0.001 and y: P = 0.003, U test). The numbers above the error bars are the numbers of events recorded; the numbers at the bottom of the bars are the numbers of cells analyzed
Fig. 5
Fig. 5
ATP stimulation increases the fusion-pore dwell time of reversible exocytotic events. a The average fusion-pore dwell time of reversible events was higher after ATP stimulation (+ATP, white bar, P = 0.003) than in controls (CON, black bar). b Distribution of fusion-pore dwell times in controls (black bars, n = 426) and after ATP (white bars, n = 370). Note the higher percentage of events with dwell time >0.5 s after ATP (23 vs. 13 % in controls). c The relationship between vesicle capacitance (C v) and fusion-pore dwell time for reversible exocytotic events in controls (black symbols) and after ATP (white symbols). Insets on the right show the percentage of events in different C v classes. In controls, the majority (87 %) of reversible events in controls had dwell time <0.5 s. After ATP, the percentage of events with C v <0.5 fF and dwell time >0.5 s doubled from 9 to 21 %. d The probability of a fusion-pore open state was slightly higher after ATP than in controls (P = 0.1). However, if only events with amplitudes <0.5 fF are considered, the probability of a fusion-pore open state increased twofold (P = 0.006), and the probability of fusion-pore open state of events with amplitudes >0.5 fF decreased by two-thirds (P = 0.002). The numbers above the error bars are the numbers of events recorded; the numbers at the bottom of the bars are the numbers of cells analyzed
Fig. 6
Fig. 6
dnSNARE locks fusion pores in a narrow state. a A schematic presentation of the dnSNARE peptide (96 aa) compared to the full length of synaptobrevin 2 (116 aa) and of SNAP23. Arrows point to botulinum neurotoxin D and E (BotD, BotE) cleavage sites on synaptobrevin 2 and SNAP23, respectively. dnSNARE consists of N-terminal and SNARE domain (RSNARE) regions but lacks the transmembrane region (TMR). b Wide-field and SIM images of vesicles immunolabeled with synaptobrevin 2 antibodies and the corresponding bimodal distribution of vesicle diameters (n = 823; 3 cells). The first population has a modal peak close to the resolution limit of the SIM system (150 ± 1 nm vs. ~120 nm, respectively), while the second population has a modal peak value of 227 ± 1 nm, matching the bimodal distribution of the data obtained in cell-attached electrophysiology measurements. Scale bar 100 nm. c To test how SNARE-interfering agents affect the transition of the fusion pore from transient to full fusion state (see Fig. 2a for diagram), we plotted the relationship between the frequency of reversible exocytotic events (transient fusion) in controls and irreversible exocytotic events (full fusion) after ATP for nontreated (nTreat) (control), BotE-treated, and BotD-treated astrocytes. Exocytotic events at <0.5 fF (red dots) exhibited a linear relationship of the form y = (0.21 ± 0.05)x (R 2 = 0.95) and exocytotic events at >0.5 fF (green dots) exhibited a linear relationship of the form y = (0.21 ± 0.002)x (R 2 = 1.0), indicating Bots cleavage is independent of vesicle diameter. dnSNARE treatment did not affect the frequency of reversible events, but only reduced the frequency of irreversible ones. Values in both dimensions show the mean ± SEM. Numbers adjacent to the symbols are the numbers of patches studied. d The percentage of projected reversible events decreased significantly for astrocytes treated with BotD (P = 0.049, n = 25), BotE (P = 0.035, n = 19) but was unchanged in dnSNARE-treated astrocytes (P = 0.45, n = 17). The numbers above the error bars are the numbers of events recorded; the numbers at the bottom of the bars are the numbers of cells analyzed. e After ATP stimulation, the decrease in mean average fusion-pore conductance (G p) of astrocytes treated with BotD (P = 0.021) or BotE (P = 0.027) was similar to that of control nontreated astrocytes (P < 0.001). However, in dnSNARE-treated astrocytes, G p was significantly lower than in nontreated astrocytes (P < 0.001) and was not further reduced after ATP (P = 0.73, t test). The numbers above the error bars are the numbers of events recorded; the numbers at the bottom of the bars are the numbers of cells analyzed
Fig. 7
Fig. 7
A model summarising the results. Stimulation with ATP increases the frequency of transient fusion pore openings of smaller vesicles, whereas larger vesicles proceed from narrow fusion pores to full fusion. dnSNARE locks fusion pores in a narrow state, preventing release of larger molecules, such as ATP, ANP or BDNF

References

    1. Araque A, Parpura V, Sanzgiri RP, Haydon PG (1999) Tripartite synapses: glia, the unacknowledged partner. Trends Neurosci 22(5):208–215. pii:S0166-2236(98)01349-6 - PubMed
    1. Cornell-Bell AH, Finkbeiner SM, Cooper MS, Smith SJ. Glutamate induces calcium waves in cultured astrocytes: long-range glial signaling. Science. 1990;247(4941):470–473. doi: 10.1126/science.1967852. - DOI - PubMed
    1. Parpura V, Basarsky TA, Liu F, Jeftinija K, Jeftinija S, Haydon PG. Glutamate-mediated astrocyte–neuron signalling. Nature. 1994;369(6483):744–747. doi: 10.1038/369744a0. - DOI - PubMed
    1. Kreft M, Stenovec M, Rupnik M, Grilc S, Krzan M, Potokar M, Pangrsic T, Haydon PG, Zorec R. Properties of Ca(2+)-dependent exocytosis in cultured astrocytes. Glia. 2004;46(4):437–445. doi: 10.1002/glia.20018. - DOI - PubMed
    1. Krzan M, Stenovec M, Kreft M, Pangrsic T, Grilc S, Haydon PG, Zorec R. Calcium-dependent exocytosis of atrial natriuretic peptide from astrocytes. J Neurosci. 2003;23(5):1580–1583. - PMC - PubMed

Publication types