. 2016 Apr 6;8(1):37.
doi: 10.1186/s13073-016-0290-3.

Microbiota-based model improves the sensitivity of fecal immunochemical test for detecting colonic lesions

Affiliations

Microbiota-based model improves the sensitivity of fecal immunochemical test for detecting colonic lesions

Nielson T Baxter et al. Genome Med. .

Abstract

Background: Colorectal cancer (CRC) is the second leading cause of death among cancers in the United States. Although individuals diagnosed early have a greater than 90% chance of survival, more than one-third of individuals do not adhere to screening recommendations partly because the standard diagnostics, colonoscopy and sigmoidoscopy, are expensive and invasive. Thus, there is a great need to improve the sensitivity of non-invasive tests to detect early stage cancers and adenomas. Numerous studies have identified shifts in the composition of the gut microbiota associated with the progression of CRC, suggesting that the gut microbiota may represent a reservoir of biomarkers that would complement existing non-invasive methods such as the widely used fecal immunochemical test (FIT).

Methods: We sequenced the 16S rRNA genes from the stool samples of 490 patients. We used the relative abundances of the bacterial populations within each sample to develop a random forest classification model that detects colonic lesions using the relative abundance of gut microbiota and the concentration of hemoglobin in stool.

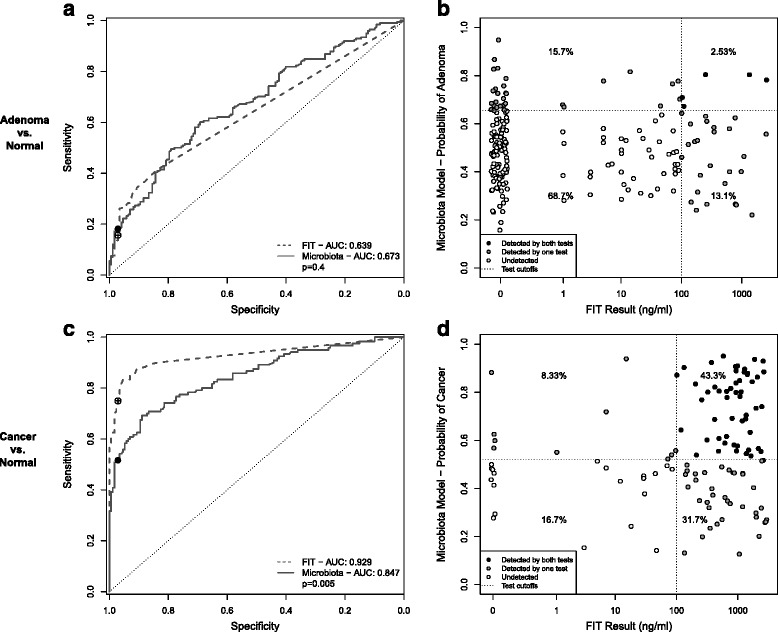
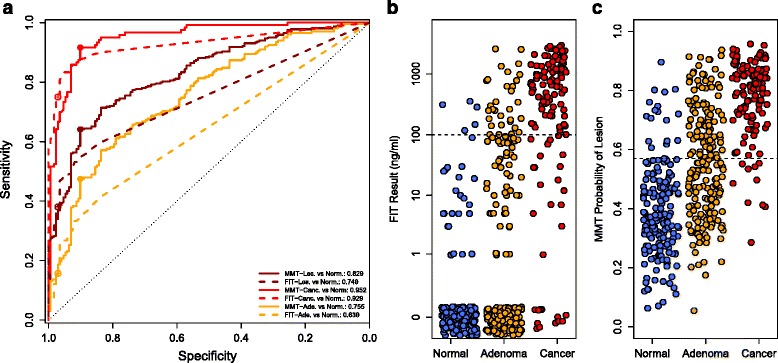
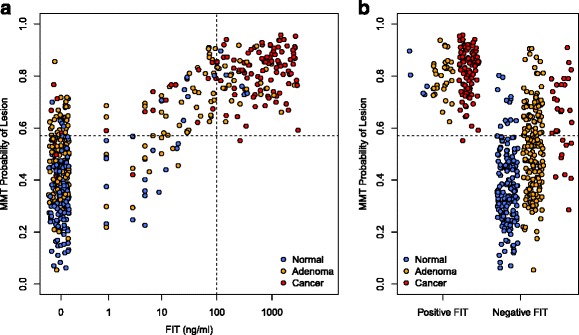
Results: The microbiota-based random forest model detected 91.7% of cancers and 45.5% of adenomas while FIT alone detected 75.0% and 15.7%, respectively. Of the colonic lesions missed by FIT, the model detected 70.0% of cancers and 37.7% of adenomas. We confirmed known associations of Porphyromonas assaccharolytica, Peptostreptococcus stomatis, Parvimonas micra, and Fusobacterium nucleatum with CRC. Yet, we found that the loss of potentially beneficial organisms, such as members of the Lachnospiraceae, was more predictive for identifying patients with adenomas when used in combination with FIT.

Conclusions: These findings demonstrate the potential for microbiota analysis to complement existing screening methods to improve detection of colonic lesions.


Figures

Fig. 1
Fig. 1
Microbiota-based models can complement FIT. a, c ROC curves for distinguishing healthy patients from those with adenoma (a) or cancer (c) based on FIT or a microbiota-based random forest model. Open circles show the sensitivity and specifity of FIT with a 100 ng/mL cutoff. Black points show the sensitivity and specificity of the microbiota-based models at the same specificity as FIT. b, d Results of FIT and a microbiota-based model for each adenoma (b) or cancer (d) sample. Dotted lines represent the cutoffs for each test. Points are shaded based on whether the lesion was detected by both tests (black), one of the two tests (gray), or neither test (white)
Fig. 2
Fig. 2
Comparing MMT to FIT. a ROC curves for the MMT (solid lines) or FIT (dashed lines) for distinguishing normal from any lesion (dark red), normal from cancer (red), and normal from adenoma (orange). Filled dots show the sensitivity and specificity of the MMT at the optimal cutoff (0.57). Open dots show the sensitivity and specificity of FIT at the 100 ng/mL cutoff. b, c Stripcharts showing the results for FIT (b) and the MMT (c). Dashed lines show the cutoff for each test. Points with a FIT result of 0 are jittered to improve visibility
Fig. 3
Fig. 3
Relationship between FIT and MMT for each sample. a Scatterplot of MMT and FIT results for each sample. Dashed lines show the cutoff for each test. Points with a FIT result of 0 are jittered to improve visibility. b Stripchart of MMT results for samples separated by binary FIT result
Fig. 4
Fig. 4
Sensitivities for FIT and MMT for each stage of tumor development with matching specificities. The cutoff for FIT was reduced to 7 ng/mL to match the specificity of the MMT. Sensitivities were compared using the method proposed by Pepe et al. (* = p <0.05, 1000 bootstrap replicates)

References

    1. Siegel R, DeSantis C, Jemal A. Colorectal cancer statistics, 2014. CA Cancer J Clin. 2014;64:104–17. doi: 10.3322/caac.21220. - DOI - PubMed
    1. Imperiale TF, Ransohoff DF, Itzkowitz SH, Levin TR, Lavin P, Lidgard GP, et al. Multitarget stool DNA testing for colorectal-cancer screening. N Engl J Med. 2014;370:1287–97. doi: 10.1056/NEJMoa1311194. - DOI - PubMed
    1. Jones RM, Devers KJ, Kuzel AJ, Woolf SH. Patient-reported barriers to colorectal cancer screening: a mixed-methods analysis. Am J Prev Med. 2010;38:508–16. doi: 10.1016/j.amepre.2010.01.021. - DOI - PMC - PubMed
    1. Hsia J, Kemper E, Kiefe C, Zapka J, Sofaer S, Pettinger M, et al. The importance of health insurance as a determinant of cancer screening: evidence from the Women’s Health Initiative. Prev Med. 2000;31:261–70. doi: 10.1006/pmed.2000.0697. - DOI - PubMed
    1. Centers for Disease Control and Prevention Vital signs: Colorectal cancer screening test use–United states, 2012. MMWR Morb Mortal Wkly Rep. 2013;62:881. - PMC - PubMed

Publication types

MeSH terms

Substances