. 2016 Apr 29;352(6285):595-9.
doi: 10.1126/science.aad9964. Epub 2016 Apr 7.

Phase separation of signaling molecules promotes T cell receptor signal transduction

Affiliations

Phase separation of signaling molecules promotes T cell receptor signal transduction

Xiaolei Su et al. Science. .

Abstract

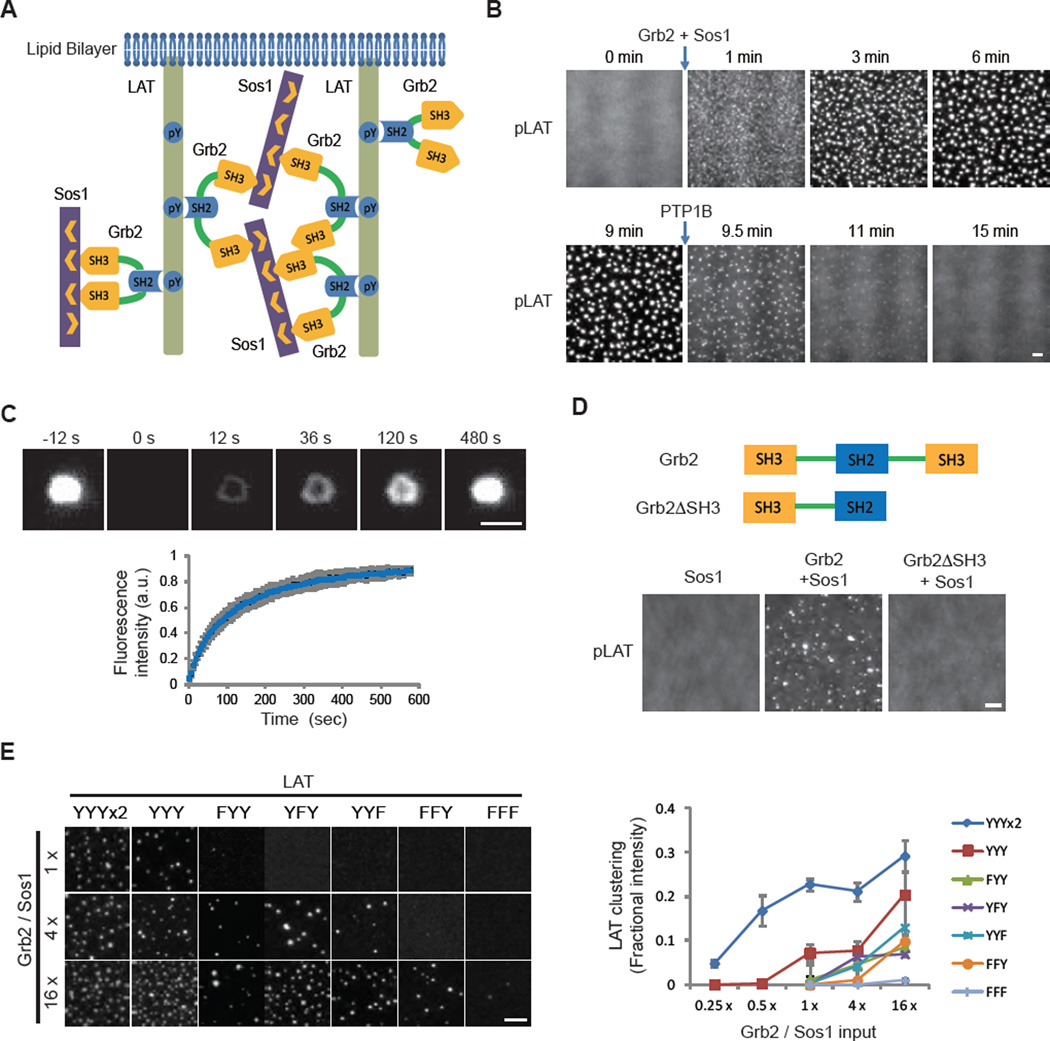
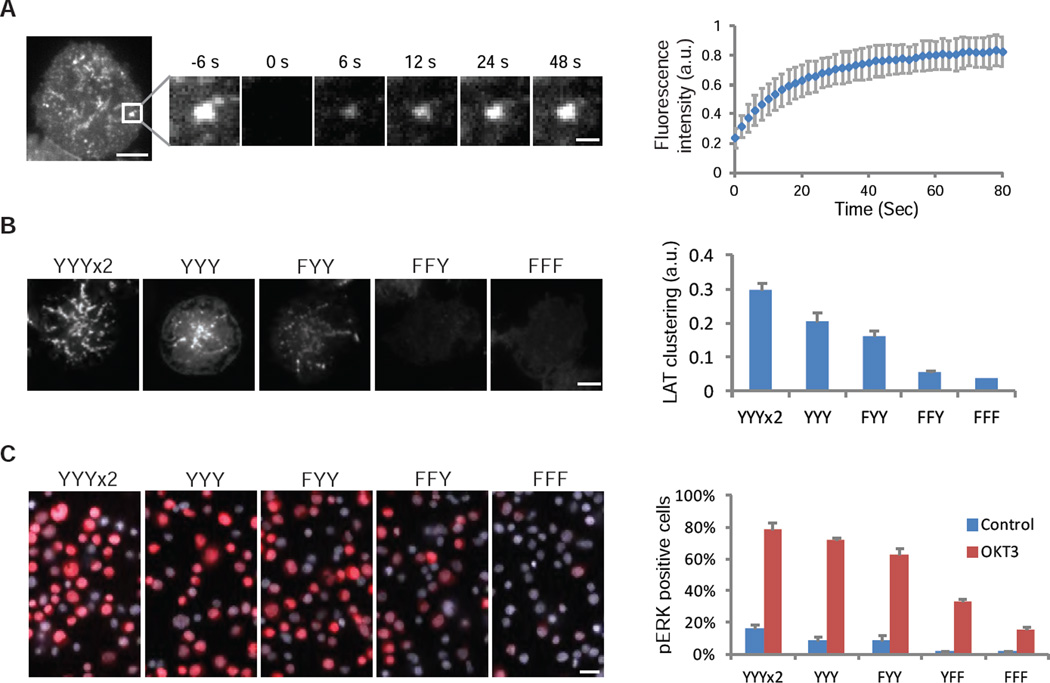
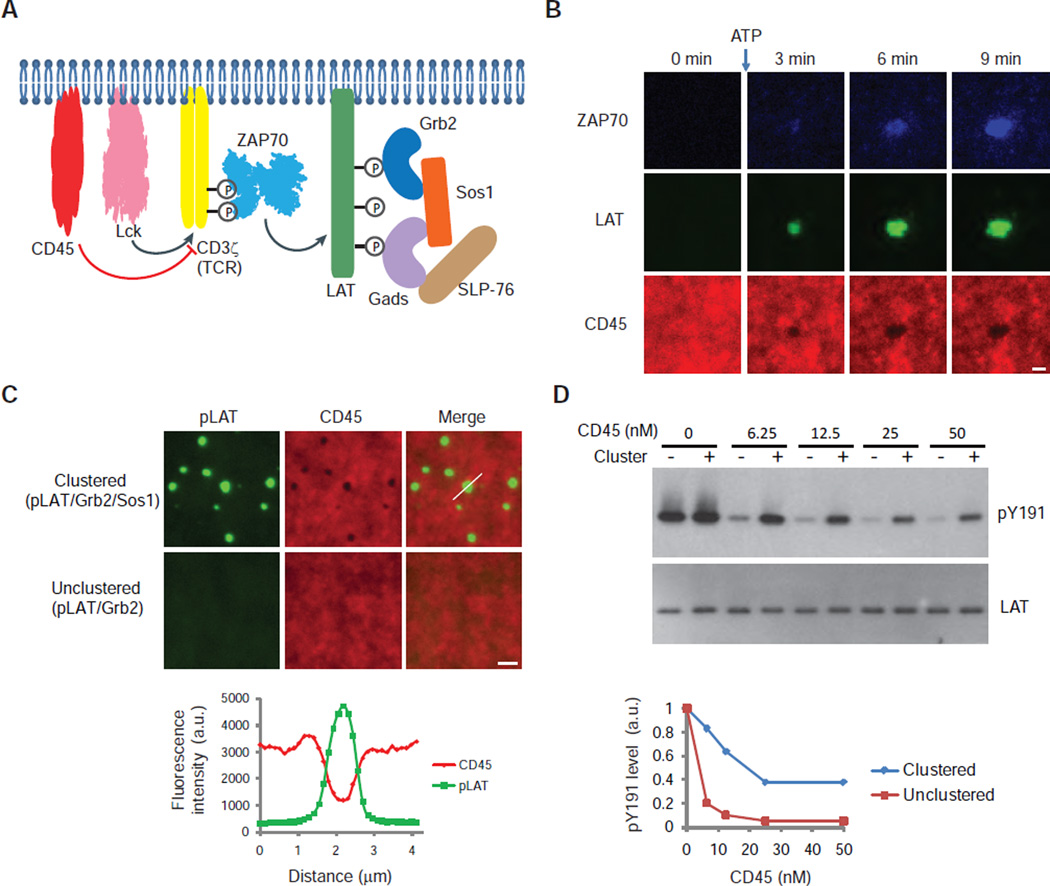
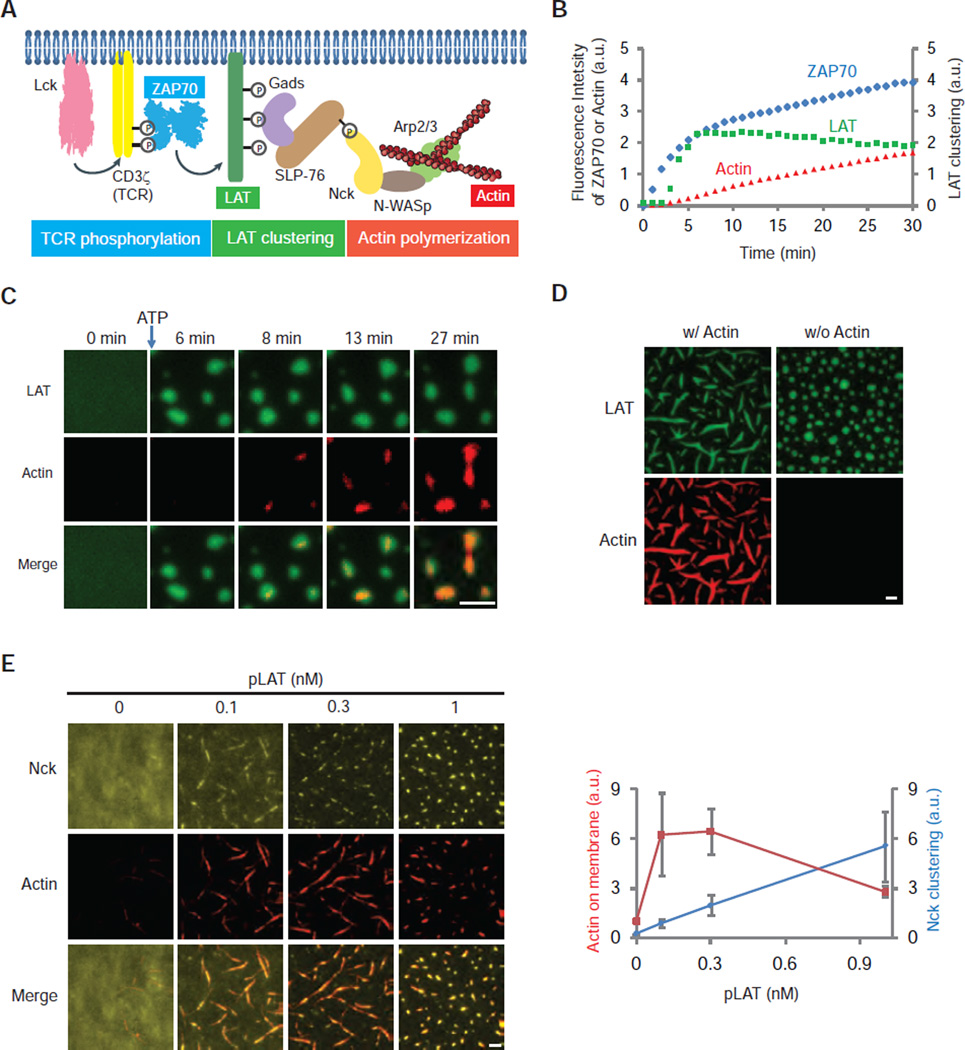
Activation of various cell surface receptors triggers the reorganization of downstream signaling molecules into micrometer- or submicrometer-sized clusters. However, the functional consequences of such clustering have been unclear. We biochemically reconstituted a 12-component signaling pathway on model membranes, beginning with T cell receptor (TCR) activation and ending with actin assembly. When TCR phosphorylation was triggered, downstream signaling proteins spontaneously separated into liquid-like clusters that promoted signaling outputs both in vitro and in human Jurkat T cells. Reconstituted clusters were enriched in kinases but excluded phosphatases and enhanced actin filament assembly by recruiting and organizing actin regulators. These results demonstrate that protein phase separation can create a distinct physical and biochemical compartment that facilitates signaling.


Figures

Fig. 1
Fig. 1. Multivalent interactions drive LAT cluster formation
(A) Schematic of the proteins and interactions in the clustering assay. (B) Total internal reflection fluorescence microscopy (TIRF) imaging of LAT clustering and declustering. Clusters formed after adding Grb2 (0.5 µM) and Sos1 (0.25 µM, the proline-rich motifs) to membrane-bound pLAT-Alexa488 (1000 molecules/µm2) at 0 min and dissolved after adding the protein tyrosine phosphatase PTP1B (2 µM) at 9 min. Scale bar: 2 µm. See movie S2. (C) Fluorescence recovery after photobleaching (FRAP) of clustered pLAT on planar lipid bilayers; time 0 indicates the time of the photobleaching pulse. Bottom plot shows the time course of the recovery of pLAT-Alexa488 (300 molecules/µm2) formed by 1 µM Grb2 and 2 µM Sos1. Shown are the mean ± s.d. (N=7 pLAT clusters). Scale bar, 2 µm. (D) TIRF imaging of pLAT-Alexa488 (300 molecules/µm2) with Sos1 (0.5 µM) alone or additionally with wild-type Grb2 (0.5 µM) or Grb2ΔSH3 (1 µM) (note-concentrations were set to maintain identical total SH3 concentrations in the experiments containing Grb2 and Grb2ΔSH3). Scale bar: 2 µm. (E) Valency-dependent clustering of pLAT. LEFT: pLAT wild-type with three Grb2 phosphorylation sites (YYY) or mutants that contain 6 (2xYYY), 2 (FYY, YFY, YYF), 1 (FFY), or 0 (FFF) phospho-tyrosines were incubated with increasing concentrations of Grb2 and Sos1. 1x indicates 125 nM Grb2 and 62 nM Sos1. pLAT valency mutants were plated at a density around 300 molecules/µm2. Clusters were imaged by TIRF microscopy. Scale bar: 5 µm. RIGHT: Quantification of clustering of pLAT valency mutants. Clustering degree was quantified by fractional intensity. Phase diagrams of pLAT mutants using a larger range of Grb2 and Sos1 concentrations are shown in fig. S5. Values shown are the mean ± s.d. (N=3 independent experiments).
Fig. 2
Fig. 2. LAT clustering promotes MAPK(ERK) signaling in T cells
(A) Fluorescence recovery after photobleaching (FRAP) of LAT-mCitrine clusters on plasma membranes of Jurkat T cells activated by anti-CD3 antibody (OKT3 at 5 µg/mL) attached to the coverslip; time 0 indicates the time of the photobleaching pulse. Scale bar, 5 µm or 1 µm on the enlarged panel. Right plot shows the time course of the recovery (mean ± s.d.) of 15 cells. (B) TIRF microscopy revealed cluster formation of LAT variants in activated T cells. A LAT-deficient line (Jcam2.5) stably expressing LAT variants containing 6 (2x YYY), 3 (YYY), 2 (FYY), 1 (FFY), or 0 (FFF) tyrosines for Grb2 binding, was activated by plate-presented OKT3 at 5 µg/mL. See Methods for clustering quantification. Scale Bar: 5 µm. Shown are mean ± s.e.m. (N=16–20 cells). (C) MAPK(ERK) activation in Jurkat T cells expressing LAT valency mutants. Cells were activated by anti-CD3 antibody OKT3 at 5 µg/mL, fixed at 10 min, and stained with an antibody to pERK (red) and a nucleus dye Hoechst (blue). Scale bar, 20 µm. Right plot shows the percentage of pERK positive cells. 200–300 cells were scored for each data point. Shown are mean ± s.e.m. (N=3 independent experiments).
Fig. 3
Fig. 3. Reconstitution of TCR phosphorylation to LAT clustering
(A) Schematic of components in a reaction designed to reconstitute signaling from TCR/CD3ζ phosphorylation to LAT clustering. The cytoplasmic domains of CD45, Lck, CD3ζ, and LAT were polyhistidine-tagged for membrane attachment and incubated with other components in solution. ATP was added to trigger the phosphorylation cascade. Input: CD45-SNAP-TMR, Lck, CD3ζ, and LAT-Alexa647 at 30, 250, 500, and 1000 molecules/µm2respectively, 10 nM ZAP70-505-Star, 250 nM Grb2, 125 nM Sos1, 250 nM Gads, 125 nM SLP-76, and 0.5 mM ATP-Mg. (B) TIRF microscopy revealed time courses of ZAP70 membrane recruitment, CD45 exclusion, and LAT clustering in the reconstituted pathway. A larger field view of LAT clusters is shown in fig. S6B. Scale bar: 2 µm. (C) TOP: pLAT-Alexa488 (300 molecules/µm2) bound to planar lipid bilayers was incubated with Grb2 (1 µM) in the presence (top) or absence (bottom) of Sos1 (1 µM). Then the cytoplasmic domain of CD45-TMR (4 nM; with an N-terminal His10 tag) was added and its localization was visualized by TIRF microscopy. Scale bar: 2 µm. BOTTOM: Quantification of fluorescence intensity of pLAT and CD45 along the line scan indicated by a white line in the top merged image. (D) Western blot analysis of pLAT dephosphorylation by CD45. pLAT bound to membrane (300 molecules/µm2) was incubated with 1 µM Grb2 (unclustered pLAT) or 1 µM Grb2 plus 1 µM Sos1 (clustered pLAT). His10-CD45 was then added and the reactions were stopped after 5 min by adding SDS-PAGE loading buffer containing 2 mM vanadate. Quantification of pLAT phosphorylation normalized to the total LAT signal is shown in the bottom plot.
Fig. 4
Fig. 4. LAT clustering promotes actin polymerization
(A) Schematic of the reconstituted signaling pathway from CD3ζ/TCR phosphorylation to actin polymerization. ZAP70-505-Star, LAT-Alexa647, and actin-Rhodamine serve as reporters for TCR phosphorylation, LAT clustering, and actin assembly, respectively. Lck, CD3ζ, and LAT were membrane attached through a polyhistidine tag and incubated with other components in solution. ATP was then added to trigger the signaling cascade. Input: same for Lck, CD3ζ, pLAT-Alexa647, and ZAP70-505-Star as described in Fig. 3A. The rest are 250 nM Gads, 125 nM SLP-76, 500 nM Nck, 250 nM N-WASp, 2.5 nM Arp2/3 complex, 500 nM actin (5% Rhodamine labeled), and 0.5 mM ATP-Mg. (B) Time courses of ZAP70 membrane recruitment, LAT clustering, and actin polymerization in the reconstituted assay after addition of ATP at time 0. LAT clustering was quantified as variance of fluorescence intensities on membranes (See Methods). (C) TIRF imaging showing actin assembly on the LAT clusters. Scale bar: 2 µm. (D) TIRF imaging of pLAT-Alexa647 and actin-Rhodamine 45 min after adding ATP to the reaction. Input: same as in Fig. 4A except with higher concentrations of components of actin and actin regulators (500 nM SLP-76, 1000 nM Nck, 500 nM N-WASp, 5 nM Arp2/3 complex, 1000 nM actin (5% Rhodamine-labeled)). Scale bar: 2 µm. (E) LEFT: TIRF microscopy images of His10-Nck-Pacific Blue and actin-Rhodamine on the bilayer. Nck (150 molecules/µm2) was attached to the bilayer and N-WASp (5 nM), Arp2/3 complex (0.25 nM), actin (200 nM; 5% Rhodamine labeled), and 0.5 mM ATP-Mg were in solution. Increasing concentrations of His-tagged pLAT were added as indicated along with Gads and pSLP-76. At 0.1 nM pLAT, Gads, and pSLP-76 concentrations were 8 nM and 4 nM, respectively. As pLAT concentration was increased, more Gads and pSLP-76 were added to maintain a constant ratio of the clustering components. Scale bar: 2 µm. RIGHT: Mean actin fluorescence (red) and Nck clustering level (blue) quantified as variance of His10-Nck fluorescence intensity, are plotted for increasing concentrations of pLAT. Shown are mean ± s.e.m. (N=3 independent experiments).

Comment in

References

    1. Wu H. Higher-order assemblies in a new paradigm of signal transduction. Cell. 2013;153:287–292. - PMC - PubMed
    1. Bienz M. Signalosome assembly by domains undergoing dynamic head-to-tail polymerization. Trends in biochemical sciences. 2014;39:487–495. - PubMed
    1. Chakraborty AK, Weiss A. Insights into the initiation of TCR signaling. Nature immunology. 2014;15:798–807. - PMC - PubMed
    1. Chan AC, Iwashima M, Turck CW, Weiss A. ZAP-70: a 70 kd protein-tyrosine kinase that associates with the TCR zeta chain. Cell. 1992;71:649–662. - PubMed
    1. Zhang W, Sloan-Lancaster J, Kitchen J, Trible RP, Samelson LE. LAT: the ZAP-70 tyrosine kinase substrate that links T cell receptor to cellular activation. Cell. 1998;92:83–92. - PubMed

Publication types

MeSH terms