. 2016:2016:7276502.
doi: 10.1155/2016/7276502. Epub 2016 Jan 21.

Urinary APE1/Ref-1: A Potential Bladder Cancer Biomarker

Affiliations

Urinary APE1/Ref-1: A Potential Bladder Cancer Biomarker

Sunga Choi et al. Dis Markers. 2016.

Abstract

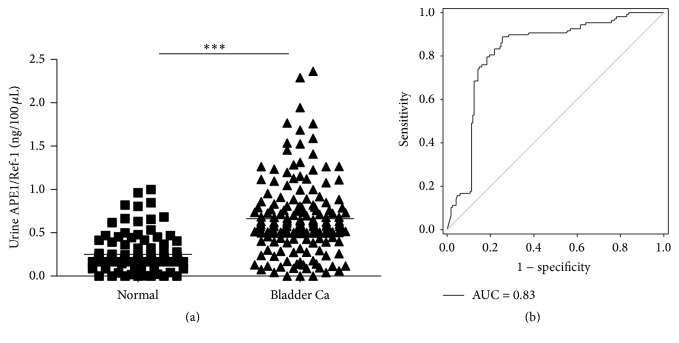
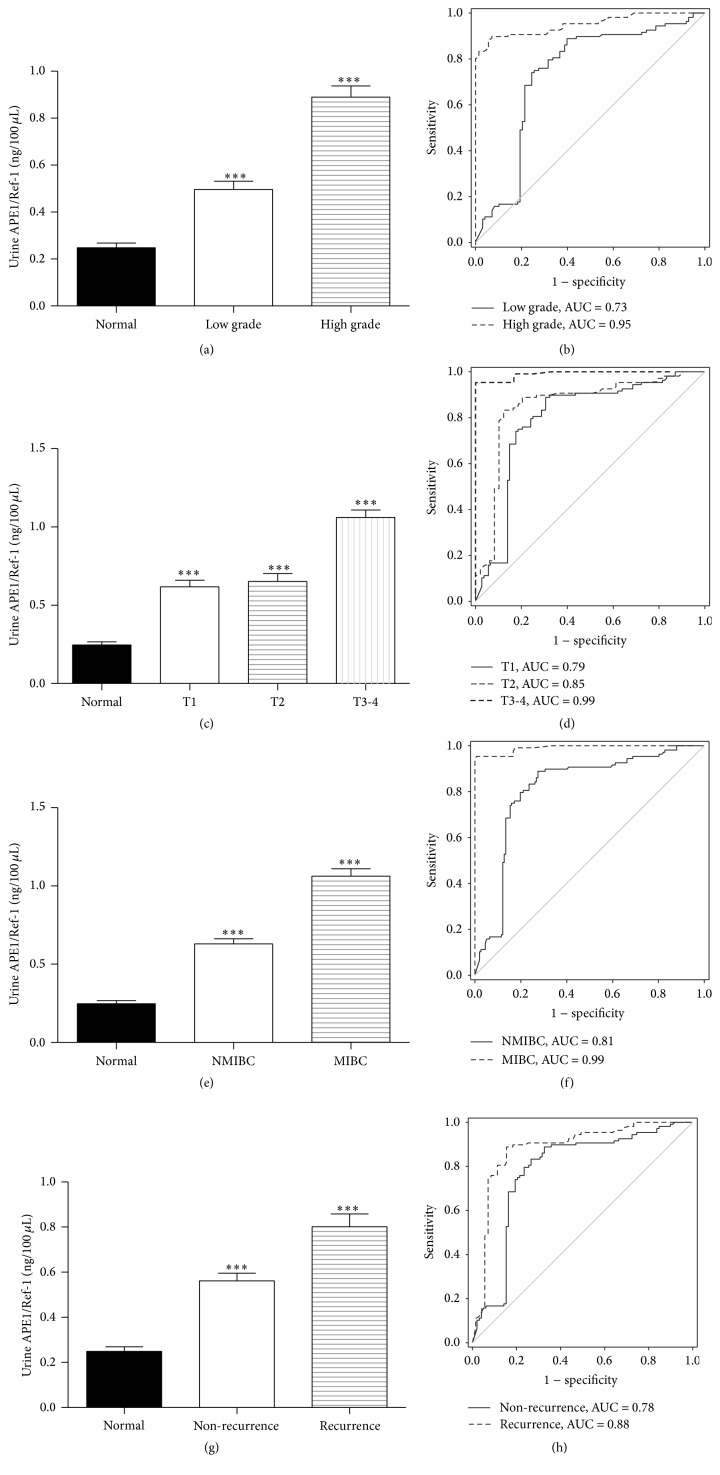
Bladder cancer (BCa) is one of the most common urothelial cancers with still noticeable incidence rate. Early detection of BCa is highly correlated with successful therapeutic outcomes. We previously showed that apurinic/apyrimidinic endonuclease 1/redox factor-1 (APE1/Ref-1) was expressed at an increased level in the serum of BCa patients when compared to the level in healthy controls. In this study, we investigated whether urinary APE1/Ref-1 was also elevated in patients with BCa. In this case-control study, voided urine was collected from 277 subjects including 169 BCa patients and 108 non-BCa controls. Urinary APE1/Ref-1 level was assessed by enzyme-linked immunosorbent assay (ELISA). APE1/Ref-1 levels were significantly elevated in BCa patients relative to levels in non-BCa controls and were correlated with tumor grade and stage. Urinary APE1/Ref-1 levels were also higher in patients with recurrence history of BCa. The receiver operating characteristics (ROC) curve of APE1/Ref-1 showed an area under the curve of 0.83, indicating the reliability and validity of this biomarker. The optimal combination of sensitivity and specificity was determined to be 82% and 80% at a cut-off value of 0.376 ng/100 μL for detection of APE1/Ref-1 in urine. In conclusion, urinary APE1/Ref-1 levels measured from noninvasively obtained body fluids would be clinically applicable for diagnosis of BCa.


Figures

Figure 1
Figure 1
Urinary APE1/Ref-1 levels are elevated in bladder cancer. (a) Urine APE1/Ref-1 levels were measured using an enzyme-linked immunosorbent assay (ELISA). The results are presented as a scatter plot. Each dot represents one patient (n = 108 for noncancer controls; n = 169 for bladder cancer patients). (b) Receiver operating characteristics (ROC) curves of APE1/Ref-1 in bladder cancer detection. The area under the curve (AUC) for the detection of all cancers by APE1/Ref-1 was 0.826.
Figure 2
Figure 2
Urinary APE1/Ref-1 levels are associated with bladder tumor grade, stage, muscle invasion, and recurrence. (a) Each bar shows the mean ± standard error of the mean (SEM) (n = 98 for low-grade tumors, n = 71 for high-grade tumors, and n = 108 for noncancer controls). (b) ROC curves for APE1/Ref-1, the determination of different bladder tumor grades. (c) Urinary APE1/Ref-1 levels are elevated in patients with higher stage tumors. Each bar shows the mean ± SEM (n = 49 for stage T1, n = 10 for stage T2, n = 2 for stage T3-T4, and n = 108 for noncancer controls). (d) ROC curves for APE1/Ref-1, the determination of different bladder tumor stages. (e) Urinary APE1/Ref-1 levels are higher in patients with muscle-invasive bladder cancer. Each bar shows the mean ± SEM (n = 157 for non-muscle-invasive bladder cancer [NMIBC], n = 12 for muscle-invasive bladder cancer [MIBC], and n = 108 for noncancer controls). (f) ROC curves for APE1/Ref-1, the determination of different of NMIBC and MIBC. (g) APE1/Ref-1 levels are higher in patients with previously recurrent tumors (n = 71 for previously recurrent tumors and n = 98 for nonrecurrent tumors). (h) ROC curves for APE1/Ref-1, the determination of recurrent bladder tumors. Bars: SEM. ∗∗∗ p < 0.01, significantly different from noncancer controls.
Figure 3
Figure 3
Urine APE1/Ref-1 levels in noncancer controls with hematuria (n = 30) did not differ significantly from the levels in noncancer controls without hematuria (n = 78). Bars: SEM. p > 0.5.

References

    1. Siegel R., DeSantis C., Virgo K., et al. Cancer treatment and survivorship statistics, 2012. CA: A Cancer Journal for Clinicians. 2012;62(4):220–241. doi: 10.3322/caac.21149. - DOI - PubMed
    1. Jung K.-W., Park S., Kong H.-J., et al. Cancer statistics in Korea: incidence, mortality, survival, and prevalence in 2008. Cancer Research and Treatment. 2011;43(1):1–11. doi: 10.4143/crt.2011.43.1.1. - DOI - PMC - PubMed
    1. Jemal A., Siegel R., Xu J., Ward E. Cancer statistics, 2010. CA: A Cancer Journal for Clinicians. 2010;60(5):277–300. doi: 10.3322/caac.20073. - DOI - PubMed
    1. Millán-Rodríguez F., Chéchile-Toniolo G., Salvador-Bayarri J., Palou J., Algaba F., Vicente-Rodríguez J. Primary superficial bladder cancer risk groups according to progression, mortality and recurrence. Journal of Urology. 2000;164(3, part 1):680–684. doi: 10.1016/s0022-5347(05)67280-1. - DOI - PubMed
    1. Budman L. I., Kassouf W., Steinberg J. R. Biomarkers for detection and surveillance of bladder cancer. Journal of the Canadian Urological Association. 2008;2(3):212–221. - PMC - PubMed

Publication types

Substances