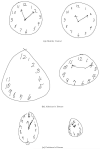
Learning Classification Models of Cognitive Conditions from Subtle Behaviors in the Digital Clock Drawing Test
- PMID: 27057085
- PMCID: PMC4821477
- DOI: 10.1007/s10994-015-5529-5
Learning Classification Models of Cognitive Conditions from Subtle Behaviors in the Digital Clock Drawing Test
Abstract
The Clock Drawing Test - a simple pencil and paper test - has been used for more than 50 years as a screening tool to differentiate normal individuals from those with cognitive impairment, and has proven useful in helping to diagnose cognitive dysfunction associated with neurological disorders such as Alzheimer's disease, Parkinson's disease, and other dementias and conditions. We have been administering the test using a digitizing ballpoint pen that reports its position with considerable spatial and temporal precision, making available far more detailed data about the subject's performance. Using pen stroke data from these drawings categorized by our software, we designed and computed a large collection of features, then explored the tradeoffs in performance and interpretability in classifiers built using a number of different subsets of these features and a variety of different machine learning techniques. We used traditional machine learning methods to build prediction models that achieve high accuracy. We operationalized widely used manual scoring systems so that we could use them as benchmarks for our models. We worked with clinicians to define guidelines for model interpretability, and constructed sparse linear models and rule lists designed to be as easy to use as scoring systems currently used by clinicians, but more accurate. While our models will require additional testing for validation, they offer the possibility of substantial improvement in detecting cognitive impairment earlier than currently possible, a development with considerable potential impact in practice.
Keywords: Clock Drawing Test; Cognitive Impairment Diagnostics; Interpretable Machine Learning; Machine Learning Applications; Medical Scoring Systems.
Figures


References
-
- Albert MS, DeKosky ST, Dickson DBD, Feldman HH, Fox NC, Gamst A, Holtzman DM, Jagust WJ, Petersen RC, Snyder PJ, Carrillo MC, Thies B, Phelps CH. The diagnosis of mild cognitive impairment due to Alzheimer’s disease: recommendations from the National Institute on Aging-Alzheimer’s Association workgroups on diagnostic guidelines for Alzheimer’s disease. Alzheimers Dement. 2011;7(3):270–279. - PMC - PubMed
-
- Andrade JT. Handbook of violence risk assessment and treatment: New approaches for mental health professionals. Springer Publishing Company; 2009.
-
- Battistin L, Cagnin A. Vascular cognitive disorder. a biological and clinical overview. Neurochemical research. 2010;35(12):1933–1938. - PubMed
-
- Borgelt C. An implementation of the FP-growth algorithm; Proceedings of the 1st International Workshop on Open Source Data Mining: Frequent Pattern Mining Implementations, OSDM ’05.2005. pp. 1–5.
-
- Borson S, Scanlan J, Brush M, Vitaliano P, Dokmak A. The mini-cog: a cognitive ‘vital signs’ measure for dementia screening in multi-lingual elderly. Int J Geriatr Psychiatry. 2000;15(11):1021–27. - PubMed
Grants and funding
LinkOut - more resources
Full Text Sources
Other Literature Sources
Medical
