

Modulating the Substrate Stiffness to Manipulate Differentiation of Resident Liver Stem Cells and to Improve the Differentiation State of Hepatocytes
- PMID: 27057172
- PMCID: PMC4737459
- DOI: 10.1155/2016/5481493
Modulating the Substrate Stiffness to Manipulate Differentiation of Resident Liver Stem Cells and to Improve the Differentiation State of Hepatocytes
Abstract
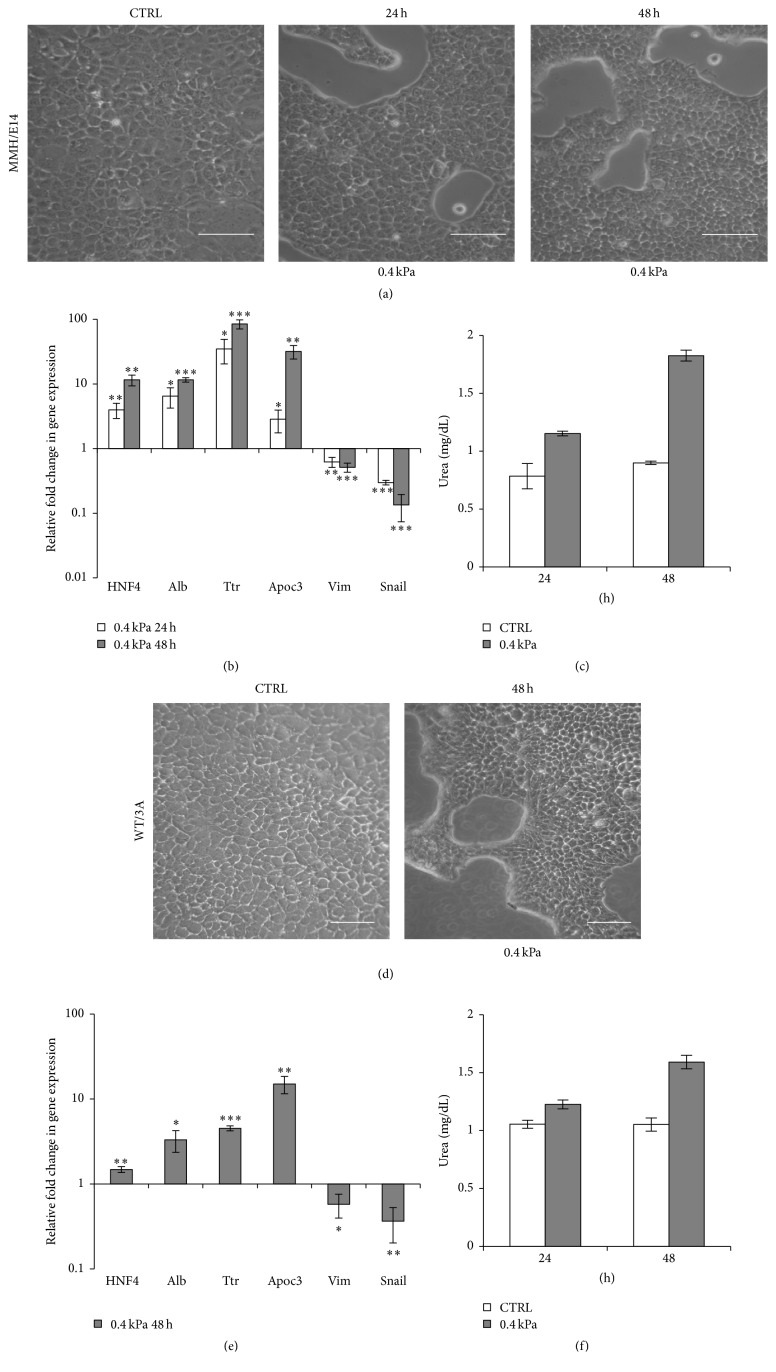
In many cell types, several cellular processes, such as differentiation of stem/precursor cells, maintenance of differentiated phenotype, motility, adhesion, growth, and survival, strictly depend on the stiffness of extracellular matrix that, in vivo, characterizes their correspondent organ and tissue. In the liver, the stromal rigidity is essential to obtain the correct organ physiology whereas any alteration causes liver cell dysfunctions. The rigidity of the substrate is an element no longer negligible for the cultivation of several cell types, so that many data so far obtained, where cells have been cultured on plastic, could be revised. Regarding liver cells, standard culture conditions lead to the dedifferentiation of primary hepatocytes, transdifferentiation of stellate cells into myofibroblasts, and loss of fenestration of sinusoidal endothelium. Furthermore, standard cultivation of liver stem/precursor cells impedes an efficient execution of the epithelial/hepatocyte differentiation program, leading to the expansion of a cell population expressing only partially liver functions and products. Overcoming these limitations is mandatory for any approach of liver tissue engineering. Here we propose cell lines as in vitro models of liver stem cells and hepatocytes and an innovative culture method that takes into account the substrate stiffness to obtain, respectively, a rapid and efficient differentiation process and the maintenance of the fully differentiated phenotype.
Figures
Similar articles
-
Cooperation of liver cells in health and disease.Adv Anat Embryol Cell Biol. 2001;161:III-XIII, 1-151. doi: 10.1007/978-3-642-56553-3. Adv Anat Embryol Cell Biol. 2001. PMID: 11729749 Review.
-
Physiological ranges of matrix rigidity modulate primary mouse hepatocyte function in part through hepatocyte nuclear factor 4 alpha.Hepatology. 2016 Jul;64(1):261-75. doi: 10.1002/hep.28450. Epub 2016 Mar 9. Hepatology. 2016. PMID: 26755329 Free PMC article.
-
Isolation and Expansion of Hepatic Stem-like Cells from a Healthy Rat Liver and their Efficient Hepatic Differentiation of under Well-defined Vivo Hepatic like Microenvironment in a Multiwell Bioreactor.J Clin Exp Hepatol. 2015 Jun;5(2):107-22. doi: 10.1016/j.jceh.2015.03.003. Epub 2015 May 15. J Clin Exp Hepatol. 2015. PMID: 26155038 Free PMC article.
-
[Bone marrow mesenchymal stem cells interactions with hepatocytes and hepatic stellate cells on different stiff substrates].Zhonghua Gan Zang Bing Za Zhi. 2019 Jun 20;27(6):424-429. doi: 10.3760/cma.j.issn.1007-3418.2019.06.007. Zhonghua Gan Zang Bing Za Zhi. 2019. PMID: 31357757 Chinese.
-
In vitro culture of isolated primary hepatocytes and stem cell-derived hepatocyte-like cells for liver regeneration.Protein Cell. 2015 Aug;6(8):562-74. doi: 10.1007/s13238-015-0180-2. Epub 2015 Jun 19. Protein Cell. 2015. PMID: 26088193 Free PMC article. Review.
Cited by
-
Frustrated endocytosis controls contractility-independent mechanotransduction at clathrin-coated structures.Nat Commun. 2018 Sep 20;9(1):3825. doi: 10.1038/s41467-018-06367-y. Nat Commun. 2018. PMID: 30237420 Free PMC article.
-
Identifying and analyzing different cancer subtypes using RNA-seq data of blood platelets.Oncotarget. 2017 Sep 15;8(50):87494-87511. doi: 10.18632/oncotarget.20903. eCollection 2017 Oct 20. Oncotarget. 2017. PMID: 29152097 Free PMC article.
-
Microenvironment and tumor cells: two targets for new molecular therapies of hepatocellular carcinoma.Transl Gastroenterol Hepatol. 2018 May 2;3:24. doi: 10.21037/tgh.2018.04.05. eCollection 2018. Transl Gastroenterol Hepatol. 2018. PMID: 29971255 Free PMC article. Review.
-
Differential modulation of cell morphology, migration, and Neuropilin-1 expression in cancer and non-cancer cell lines by substrate stiffness.Front Cell Dev Biol. 2024 Jun 5;12:1352233. doi: 10.3389/fcell.2024.1352233. eCollection 2024. Front Cell Dev Biol. 2024. PMID: 38903533 Free PMC article.
-
Microtissue Geometry and Cell-Generated Forces Drive Patterning of Liver Progenitor Cell Differentiation in 3D.Adv Healthc Mater. 2021 Jun;10(12):e2100223. doi: 10.1002/adhm.202100223. Epub 2021 Apr 23. Adv Healthc Mater. 2021. PMID: 33890430 Free PMC article.
References
LinkOut - more resources
Full Text Sources
Other Literature Sources
