. 2016 May 10;7(19):28096-111.
doi: 10.18632/oncotarget.8581.

Differential effects of lenalidomide during plasma cell differentiation

Affiliations

Differential effects of lenalidomide during plasma cell differentiation

Michel Jourdan et al. Oncotarget. .

Abstract

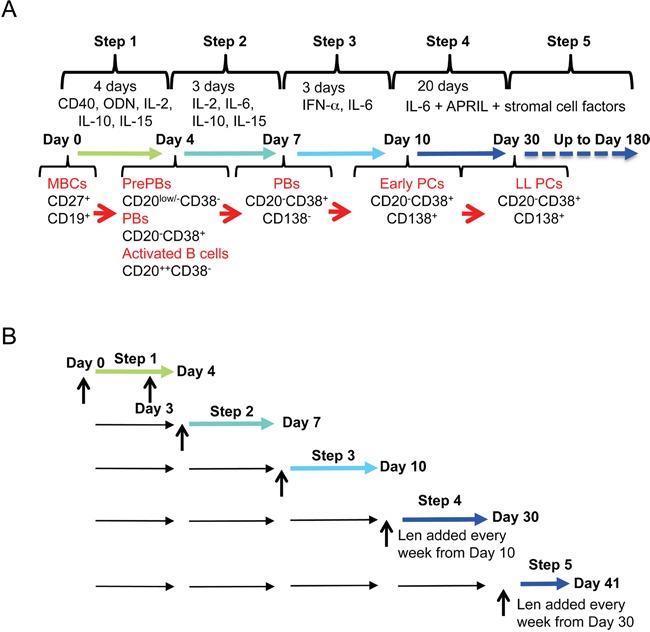
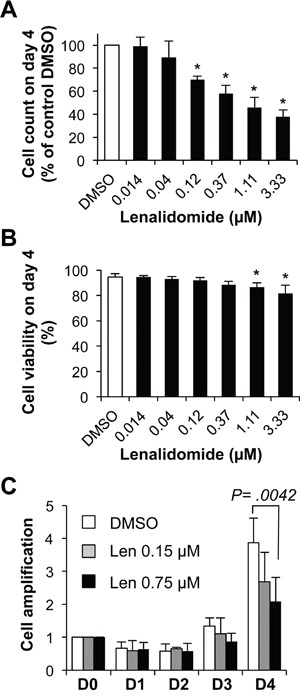
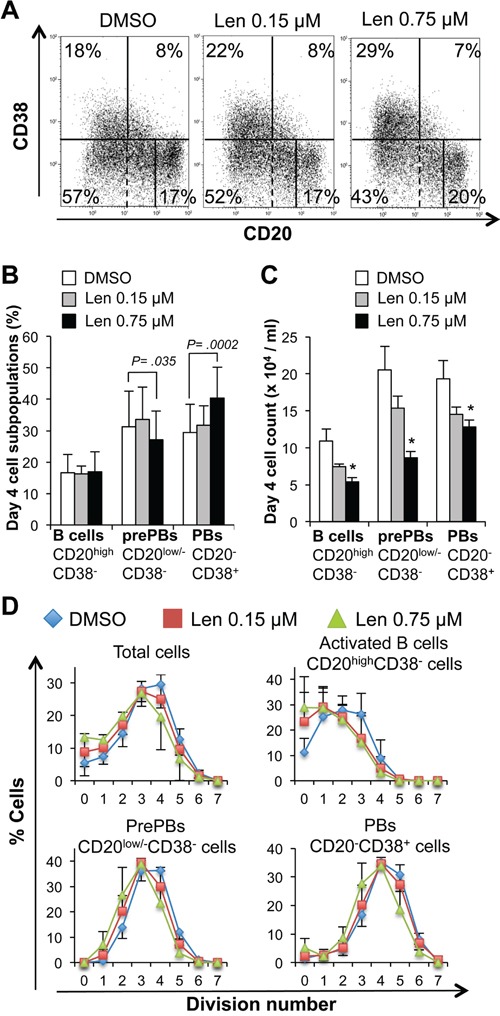
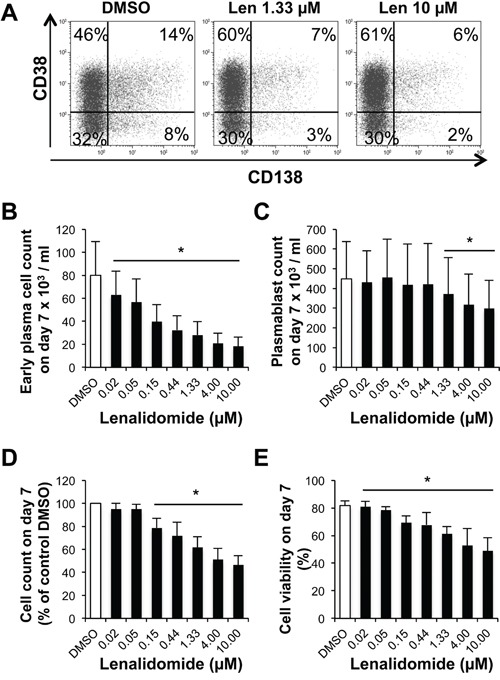
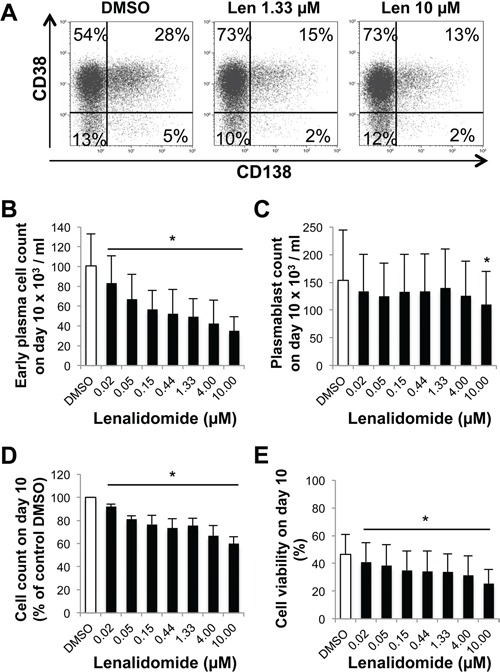
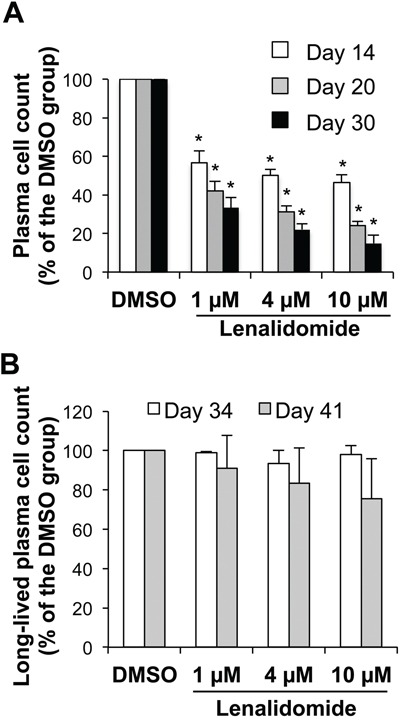
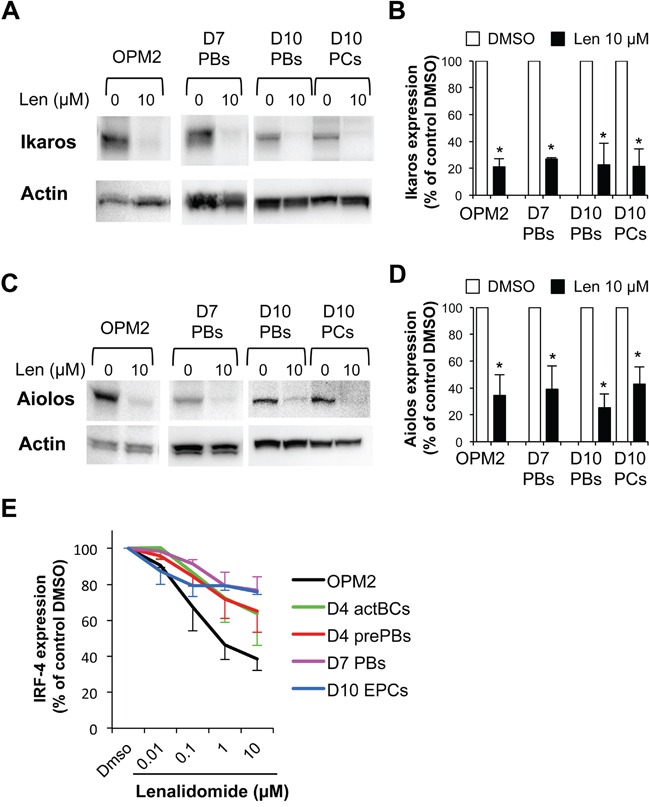
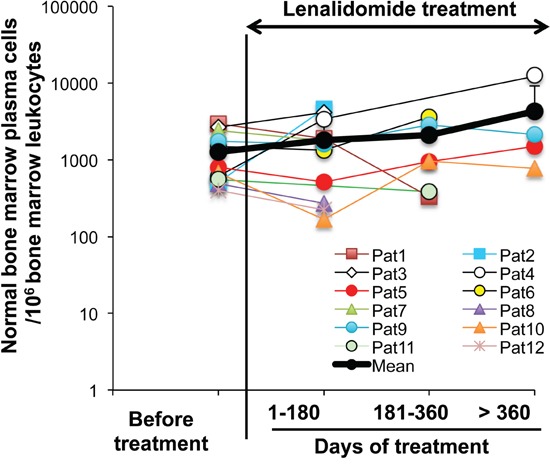
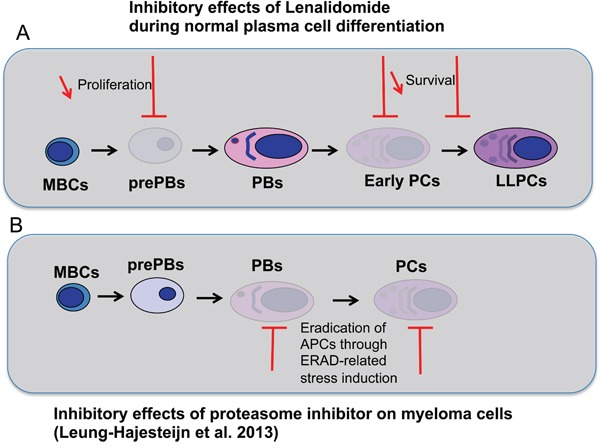
Thalidomide, lenalidomide and pomalidomide have greatly improved the outcome of patients with multiple myeloma. However, their effects on plasma cells, the healthy counterpart of myeloma cells, are unknown. Here, we investigated lenalidomide effects on normal human plasma cell generation using an in vitro model. Lenalidomide inhibited the generation of pre-plasmablasts and early plasma cells, while it moderately affected plasmablast production. It also reduced the expression level of Ikaros, Aiolos, and IRF4 transcription factors, in plasmablasts and early plasma cells. This suggests that their differential sensitivity to lenalidomide is not due to a difference in Ikaros or Aiolos degradation. Lenalidomide also inhibited long-lived plasma cell generation, but did not impair their long-term survival once generated. This last observation is in agreement with the finding that lenalidomide treatment for 3-18 months did not affect the bone marrow healthy plasma cell count in allografted patients with multiple myeloma. Our findings should prompt to investigate whether lenalidomide resistance in patients with multiple myeloma could be associated with the emergence of malignant plasmablasts or long-lived plasma cells that are less sensitive to lenalidomide.

Keywords: IKZF1; IKZF3; differentiation; lenalidomide; plasma cell.


Conflict of interest statement

This study was partly supported by research funding from Celgene Corporation. RC and PS are employees of Celgene and hold stock options in Celgene. GC has received honoraria from Celgene. The remaining authors declare no conflict of interest.

Figures

Figure 1
Figure 1. In vitro model to investigate lenalidomide effect during memory B cell differentiation into long-lived plasma cells
A. Using a five-step culture system, human memory B cells are induced to differentiate into long-lived plasma cells from day 0 to day 30. They can then be maintained in culture up to day 180. The cytokines used and the phenotype of the obtained cell populations at each step are indicated. B. The effect of lenalidomide on the different populations (from memory B cells to plasma cells) is investigated at the end of each differentiation step. Vertical arrows indicate when lenalidomide is added.
Figure 2
Figure 2. Effect of lenalidomide on cell growth in the first four days of in vitro memory B cell differentiation into plasma cells
1.5 × 10⁵ MBCs were activated with ODN and CD40L and cultured for four days with IL-2, IL-10, IL-15 and in the presence of increasing concentrations of lenalidomide or the largest DMSO concentration used to dilute lenalidomide (DMSO; control). A. Counts of cells recovered at the end of the four days of culture. B. Cell viability was assayed by trypan blue exclusion at day 4. C. Kinetics of cell amplification from D0 to D4, cells were cultured in the presence of control DMSO, 0.15 μM or 0.75 μM lenalidomide. Results are the mean value ± SD of four experiments. * P ≤ .05, compared with the control DMSO group using a paired t-test.
Figure 3
Figure 3. Lenalidomide reduces the generation of pre-plasmablasts in the first step of the B cell to plasma cell differentiation model
MBCs were activated with ODN and CD40L and cultured for four days with IL-2, IL-10, IL-15 and in the presence of increasing concentrations of lenalidomide or the largest DMSO concentration used to dilute lenalidomide (DMSO; control). The percentage and count of activated B cells (CD20highCD38), prePBs (CD20low/−CD38) and PBs (CD20CD38+) were determined by FACS analysis at day 4. A. Dot plot of CD20 and CD38 expression in day-4 cells (one representative experiment out of seven). The numbers in the panels (gates) are the percentages of gated day-4 cells. Dashed lines indicated the limit of CD20 positivity determined using an isotype-matched control antibody. B and C. Mean percentage and count ± SD (seven separate experiments) of activated B cells, prePBs and PBs at day 4 following incubation with 0.15 μM or 0.75 μM lenalidomide. D. Mean number (three separate experiments) of cell divisions to generate activated B cells, prePBs, or PBs at day 4. Cells were labeled with CFSE at the start of the culture and the decrease in CFSE staining due to cell division was evaluated at day 4. * P ≤ .05, compared with the control DMSO group using a paired t-test.
Figure 4
Figure 4. Lenalidomide preferentially targets the generation of CD138+ early plasma cells and poorly affects that of plasmablasts in the second step of in vitro B cell differentiation into plasma cells
Cells harvested at the end of step 1 (day-4 cells: mainly prePBs and PBs) were cultured with IL-2, IL-6, IL-10 and IL-15 in the presence of graded concentrations of lenalidomide or the largest DMSO concentration used to dilute lenalidomide (DMSO) for three days. The percentage and counts of PBs (CD20CD38+CD138) and early PCs (CD20CD38+CD138+) were determined by FACS analysis at day 7. A. Dot plot of CD38 and CD138 expression in day-7 cells (one representative experiment out of four). The numbers in the panels (gates) are the percentage of gated day-7 cells. B and C. Mean count ± SD of early PCs and PBs at day 7 in the presence of increasing lenalidomide concentrations from day 4 to day 7 (four separate experiments). D and E. Mean count and viability ± SD of all day-7 cells in the presence of increasing lenalidomide concentrations from day 4 to day 7 (four separate experiments). * P ≤ .05, compared with the DMSO control group using a paired t-test.
Figure 5
Figure 5. Lenalidomide preferentially targets the generation of CD138+ early plasma cells and poorly affects plasmablasts in the third step of the B cell to plasma cell differentiation model
Cells harvested at the end of step 2 (day-7 cells, mainly PBs and early PCs) were cultured with IL-6, IL-15 and IFN- α for three days (step 3) in the presence of increasing concentrations of lenalidomide or the largest DMSO concentration used to dilute lenalidomide (DMSO; control). The percentage and counts of PBs (CD20CD38+CD138) and early PCs (CD20CD38+CD138+) were determined by FACS analysis at day 10. A. Dot plot of CD38 and CD138 expression in day-10 cells (one representative experiment out of four). The numbers in the panels (gates) are the percentage of gated day-10 cells. B and C. Mean count ± SD of early PCs or PBs at day 10 in the presence of increasing lenalidomide concentrations from day 7 to day 10 (four separate experiments). D and E. Mean count and viability ± SD of all day-10 cells in the presence of increasing lenalidomide concentrations from day 7 to day 10 (four separate experiments). * P ≤ .05, compared with the DMSO control group using a paired t-test.
Figure 6
Figure 6. Lenalidomide targets the generation, but not the survival of long-lived plasma cells
Early PCs generated at the end of step 3 (day-10 cells) were FACS-sorted based on CD138 expression and lack of CD20 expression (> 95% purity). A. Purified early PCs were cultured for 4, 10 or 20 days with IL-6, APRIL and stromal cell-conditioned medium (SC-CM) in the presence of increasing concentrations of lenalidomide or the largest DMSO concentration used to dilute lenalidomide (DMSO). Fresh lenalidomide, DMSO, culture medium, cytokines and SC-CM were refreshed every week by replacing half of the culture medium. Counts of metabolically active LLPCs were assayed at day 14, 20 and 30 using a Cell Titer Glo Assay. Data are expressed as the percentage (mean ± SD; n= three separate experiments) of the values obtained in controls (DMSO). B. 30-day LLPCs were incubated with increasing lenalidomide concentrations or the largest DMSO concentration used to dilute lenalidomide (DMSO) for 4 or 11 days. Fresh lenalidomide, control DMSO, culture medium, cytokines and SC-CM were refreshed every week, by replacing half of the culture medium. Counts of metabolically active LLPCs were assayed at day 34 and 41. Data are expressed as the percentage (mean ± SD; n= three separate experiments) of the values obtained in controls (DMSO). * P ≤ .05, compared with the control group (DMSO) using a paired t-test.
Figure 7
Figure 7. Ikaros, Aiolos and IRF4 are expressed in plasmablasts and early plasma cells and their expression is reduced by lenalidomide
PBs generated at step 2 (day-7 cells), PBs and early PCs generated at step 3 (day-10 cells) were incubated with 10 μM lenalidomide or control DMSO for the last 24 hours of culture and were FACS-sorted based on CD38 expression and lack of CD20 and CD138 expression19 (PBs, ≥ 95% purity), and on CD138 and CD38 expression and lack of CD20 expression (early PCs ≥ 95% purity). OPM2 myeloma cells were incubated with 10 μM lenalidomide or control DMSO for 24 hours. Cell lysates were separated by SDS-PAGE and Ikaros and Aiolos expression assessed by immunoblotting. β actin expression was used as loading control. Representative western blot of Ikaros A. and Aiolos C. expression (three separate experiments). Data in B and D. are the mean Ikaros and Aiolos expression in the three experiments, quantified by densitometry analysis and normalized to actin levels. * P ≤ .05, compared with the control group (DMSO) using a paired t-test. E. Lenalidomide reduces IRF4 expression. Cells were cultured in the presence of increasing concentrations of lenalidomide or DMSO (control). Lenalidomide was added for three or four days at the beginning of each step, as indicated in Supplementary Figure S1B. The human myeloma cell line OPM2 was cultured for 3 days. At the end of each step, IRF4 expression was measured by flow cytometry analysis. Data are expressed as the percentage (mean ± SD; 3 separate experiments) of the IRF4 staining index values obtained in the control group (DMSO).
Figure 8
Figure 8. Lenalidomide treatment does not affect the counts of normal bone marrow plasma cells in allografted patients with multiple myeloma
Twelve patients with MM who received an allogeneic hematopoietic stem cell transplant were treated with 25 mg lenalidomide daily for 3-18 months. Tumor and normal PCs were regularly monitored. All the patients had stable counts of tumor PCs during lenalidomide treatment. Normal PCs were identified as CD38high, CD19+, CD27+, CD56, CD117, CD200 and cytoplasmic Kappa or Lambda Ig light chain+ cells using multicolor cytometry. Data are expressed as the normal PC counts/106 leukocytes in the BM of each patient, harvested before and at different times during lenalidomide treatment. The black bold line represents the mean value of the patients' PC counts.
Figure 9
Figure 9. Effects of lenalidomide and proteasome inhibitor on the different stages of plasma cell differentiation
A. During plasma cell differentiation, lenalidomide inhibits the generation of prePBs, early PCs and LLPCs but has a moderate inhibitory effect on PBs and LLPCs once generated. B. As shown by Leung-Hagesteijn et al. in multiple myeloma [28], antibody-producing cells (APCs), PBs and PCs, are sensitive to proteasome inhibitor because of their high level of Ig synthesis. Proteasome inhibitor treatment induces endoplasmic reticulum-associated protein degradation (ERAD)-related stress.

References

    1. Barlogie B, Desikan R, Eddlemon P, Spencer T, Zeldis J, Munshi N, Badros A, Zangari M, Anaissie E, Epstein J, Shaughnessy J, Ayers D, Spoon D, Tricot G. Extended survival in advanced and refractory multiple myeloma after single-agent thalidomide: identification of prognostic factors in a phase 2 study of 169 patients. Blood. 2001;98:492–4. - PubMed
    1. Attal M, Lauwers-Cances V, Marit G, Caillot D, Moreau P, Facon T, Stoppa AM, Hulin C, Benboubker L, Garderet L, Decaux O, Leyvraz S, Vekemans MC, et al. Lenalidomide maintenance after stem-cell transplantation for multiple myeloma. N Engl J Med. 2012;366:1782–91. - PubMed
    1. Lacy MQ, McCurdy AR. Pomalidomide. Blood. 2013;122:2305–9. - PubMed
    1. Shortt J, Hsu AK, Johnstone RW. Thalidomide-analogue biology: immunological, molecular and epigenetic targets in cancer therapy. Oncogene. 2013;32:4191–202. - PubMed
    1. Ito T, Ando H, Suzuki T, Ogura T, Hotta K, Imamura Y, Yamaguchi Y, Handa H. Identification of a primary target of thalidomide teratogenicity. Science. 2010;327:1345–50. - PubMed

MeSH terms