. 2016 Sep 1;23(9):1502-14.
doi: 10.1038/cdd.2016.36. Epub 2016 Apr 8.

Metabolic reprogramming during neuronal differentiation

Affiliations

Metabolic reprogramming during neuronal differentiation

M Agostini et al. Cell Death Differ. .

Abstract

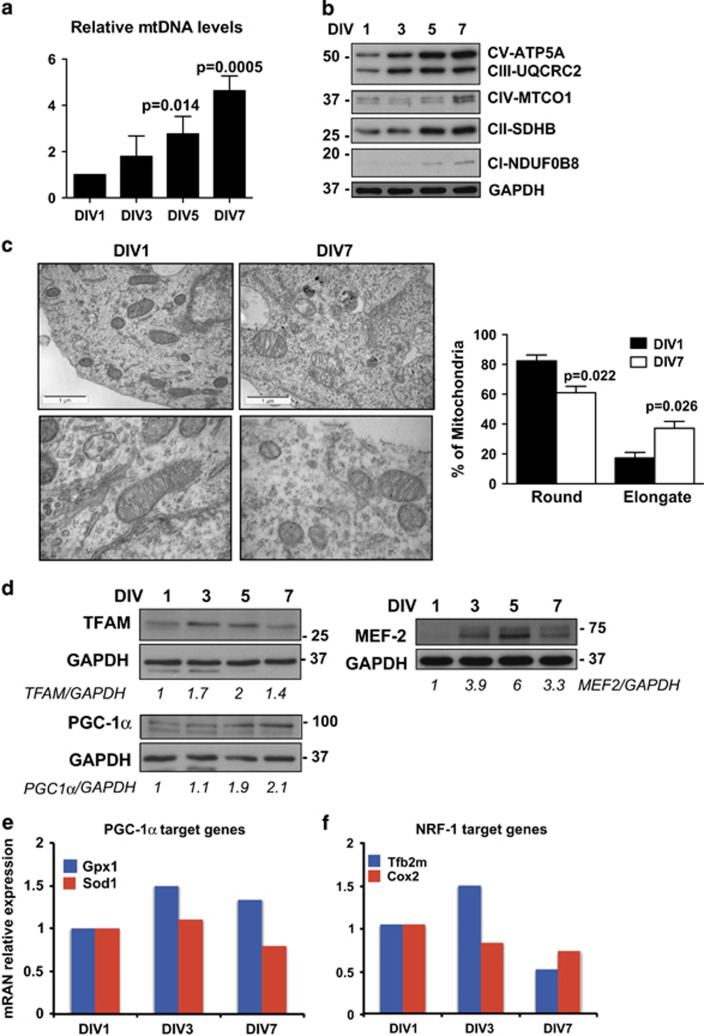
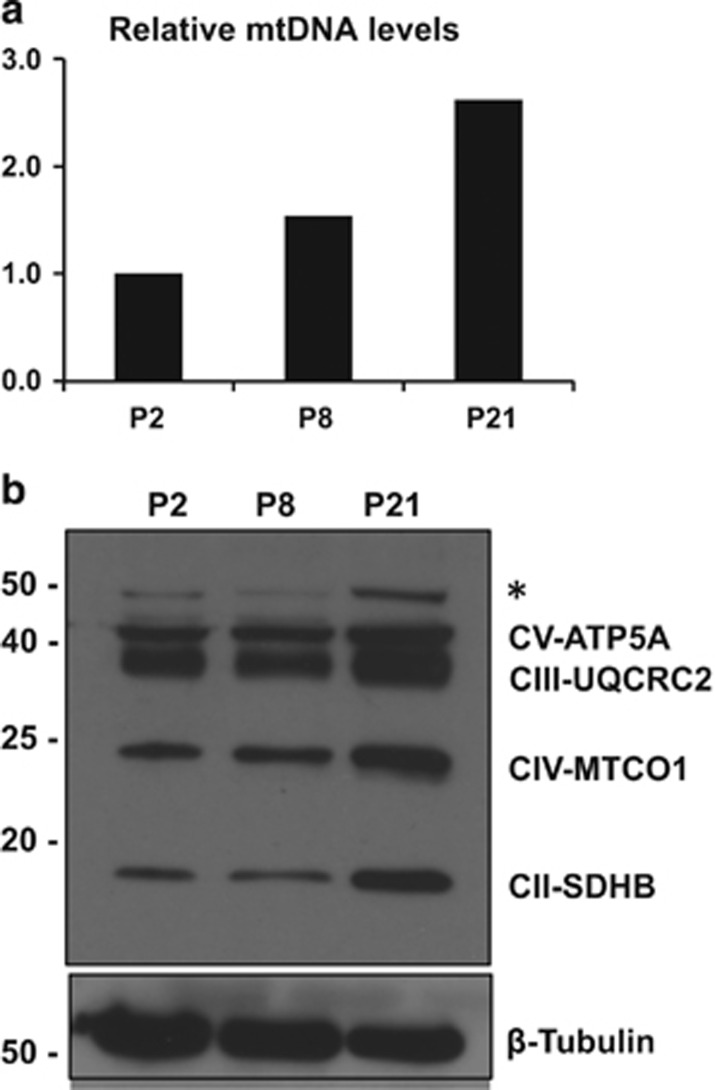
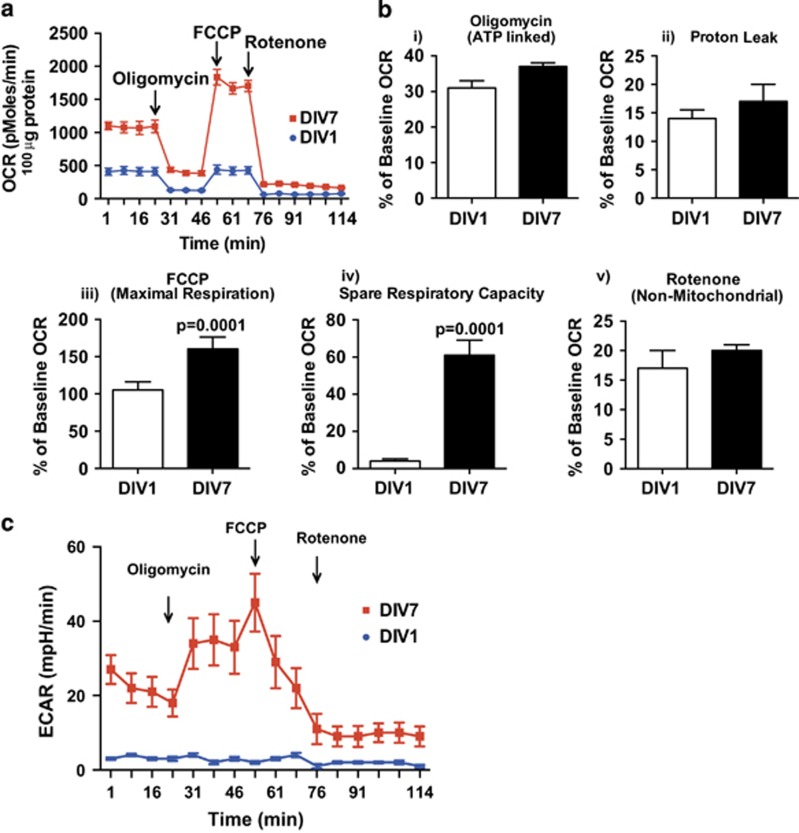
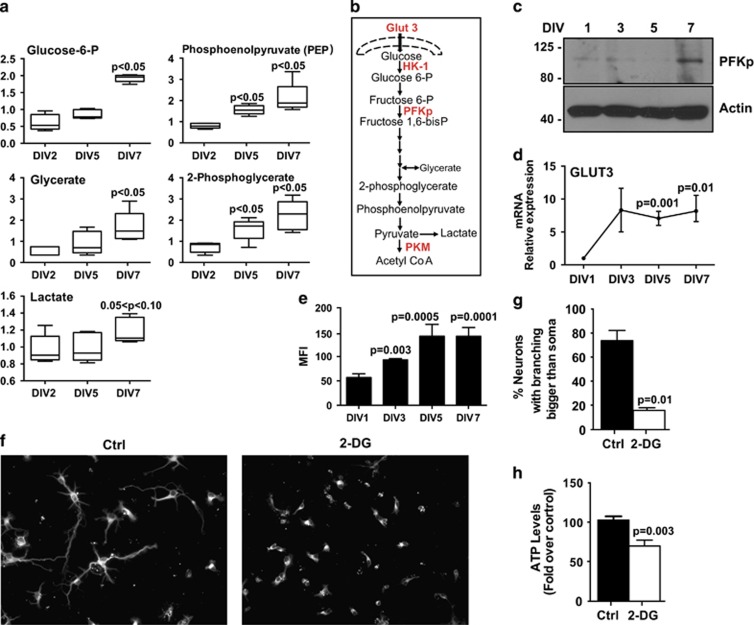
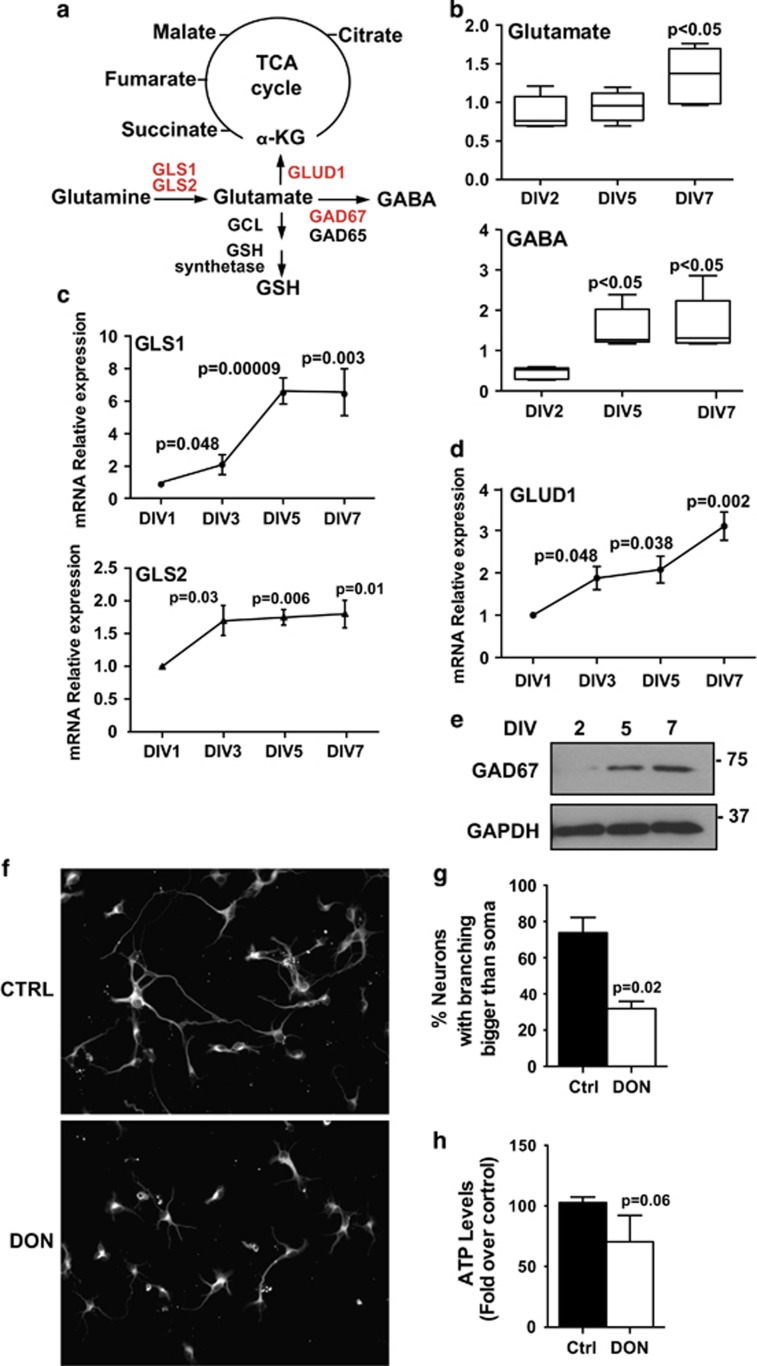
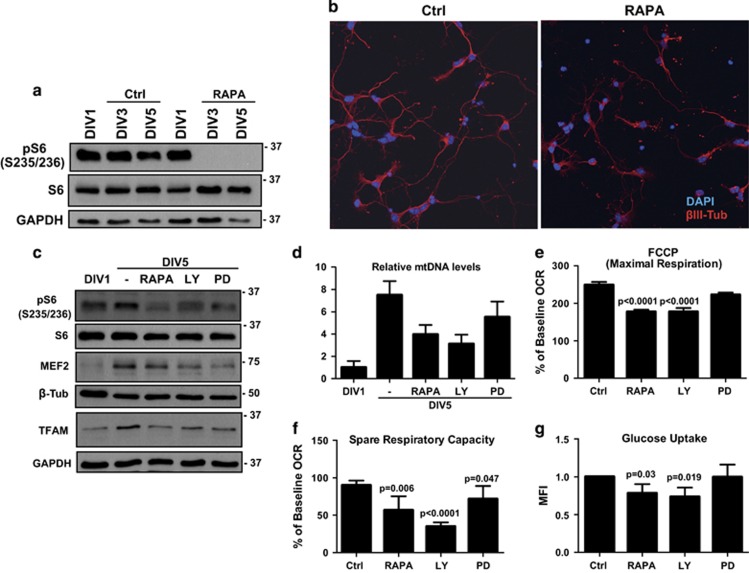
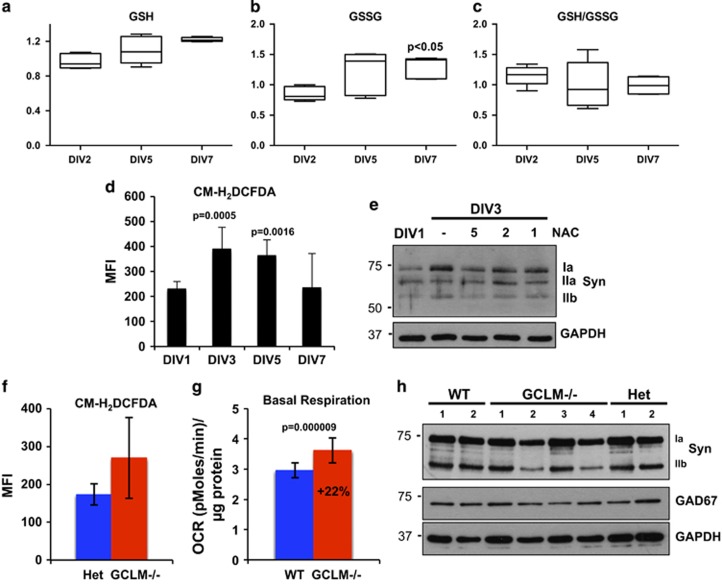
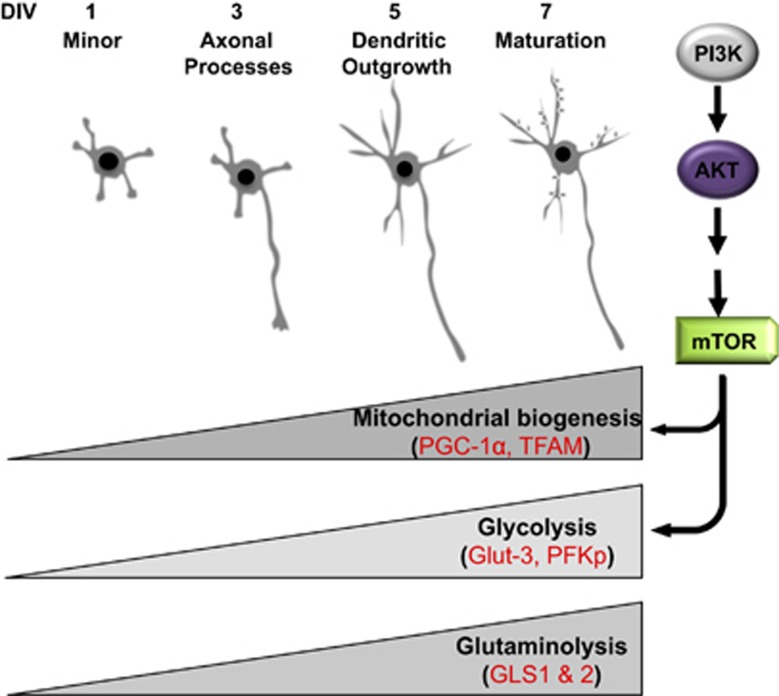
Newly generated neurons pass through a series of well-defined developmental stages, which allow them to integrate into existing neuronal circuits. After exit from the cell cycle, postmitotic neurons undergo neuronal migration, axonal elongation, axon pruning, dendrite morphogenesis and synaptic maturation and plasticity. Lack of a global metabolic analysis during early cortical neuronal development led us to explore the role of cellular metabolism and mitochondrial biology during ex vivo differentiation of primary cortical neurons. Unexpectedly, we observed a huge increase in mitochondrial biogenesis. Changes in mitochondrial mass, morphology and function were correlated with the upregulation of the master regulators of mitochondrial biogenesis, TFAM and PGC-1α. Concomitant with mitochondrial biogenesis, we observed an increase in glucose metabolism during neuronal differentiation, which was linked to an increase in glucose uptake and enhanced GLUT3 mRNA expression and platelet isoform of phosphofructokinase 1 (PFKp) protein expression. In addition, glutamate-glutamine metabolism was also increased during the differentiation of cortical neurons. We identified PI3K-Akt-mTOR signalling as a critical regulator role of energy metabolism in neurons. Selective pharmacological inhibition of these metabolic pathways indicate existence of metabolic checkpoint that need to be satisfied in order to allow neuronal differentiation.


Figures

Figure 1
Figure 1
In vitro terminal differentiation of cortical neurons is associated with mitochondrial biogenesis. (a) Relative quantification of mtDNA copy number during differentiation of cortical neurons. Real-time PCR was performed with primers against a single-copy nuclear gene succinate dehydrogenase complex, subunit A and the mitochondrially encoded NADH dehydrogenase 5 gene. (b) Expression of the different complexes of ETC increases along the differentiation. Western blotting was performed with MitoProfile Total OXPHOS. (c) Transmission electron microscopy analysis of DIV1 and DIV7 neurons. The mitochondria at DIV1 are small and rounded, with a dense matrix. At DIV7, the mitochondria have a much less dense matrix and the percentage of mitochondria with elongated shape increase, as shown in the graph (right panel). For comparison, we restricted imaging to the perinuclear/Golgi region. (d) Western blotting analysis of the transcription factors TFAM, PGC-1α, MEF-2 and NRF-1 during in vitro terminal differentiation of cortical neurons. Numbers indicate densitometric analysis of a representative experiment. (e and f) RNA levels of the indicated PGC-1α and NRF-1 target genes during in vitro terminal differentiation of cortical neurons, respectively. RNA levels were assessed by real-time PCR
Figure 2
Figure 2
Mitochondrial biogenesis during postnatal development of murine cerebral cortex. (a) Relative quantification of mtDNA copy number at the indicated postnatal day. Real-time PCR was performed with primers against a single-copy nuclear gene succinate dehydrogenase complex, subunit A and the mitochondrially encoded NADH dehydrogenase 5 gene. (b) Expression of the different complexes of ETC increases along the postnatal development of cerebral cortex. Western blotting was performed with MitoProfile Total OXPHOS. A representative experiment is shown. P, postnatal day. *Aspecific
Figure 3
Figure 3
Mitochondrial bioenergetics analysis during in vitro terminal differentiation of cortical neurons. (a) Real-time analysis of OCR in cortical neurons at DIV1 and DIV7. ATP synthase inhibitor oligomycin, mitochondrial uncoupler FCCP and mitochondrial complex I inhibitor Rotenone were injected sequentially at the indicated time points into each well after baseline rate measurement. Fully differentiated cortical neurons (DIV7) show higher basal OCR then undifferentiated neurons (DIV1). A representative experiment of four independent is shown. (b) (i) ATP-linked; (ii) proton leak and (iii) maximal respiration is higher in fully differentiated neurons when compared with the undifferentiated neurons. At DIV7, cortical neurons have spare respiratory capacity that is absent in DIV1 cortical neurons (iv); (v) non-mitochondrial respiration. Each group is shown as a percentage of baseline (measurement before oligomycin injection). (c) ECAR is present only at DIV7 and not at DIV1. ECAR were measured using the XF24 Analyser (see Materials and Methods section for details). A representative experiment of four independent is shown. Values are mean±S.D. (A representative of three independent experiment is shown. Each point, n=5 technical replicates)
Figure 4
Figure 4
Glucose metabolism increases during in vitro terminal differentiation of cortical neurons. (a) Glucose metabolism is increased in differentiating neurons as indicated by increases of glycolytic metabolites over time. Levels of the indicated metabolites were evaluated as described in Materials and Methods section. Welch's two-sample t-tests were used to identify biochemicals that differed significantly between experimental groups (n=5 for each time point). (b) Glycolytic pathway with the assayed glycolytic genes in red. (c and d) Expression of glycolytic genes during in vitro terminal differentiation of cortical neurons. Protein levels of phosphofructokinase-1 (platelet isoform PFKp, neuron specific) and mRNA levels of glucose transporter 3 (GLUT3) increase during differentiation of cortical neurons. Enzymes levels were evaluated by real-time PCR. Data are normalized to the housekeeping GAPDH and relative to DIV1. Note that the enzymes investigated are brain and neuron specific. (e) Glucose uptake of cortical neurons at the indicated stages of differentiation was assayed with 2-NBDG by FACS analysis. (f) Pharmacological inhibition of glycolysis negatively affect cortical neuron differentiation. Cortical neurons were plated at DIV1 and untreated (CTRL) or treated with 2-DG (10 mM) for 48 h. Representative micrographs of DIV3 cortical neurons stained with β-III-Tubulin are shown. (g) Quantification of neuronal differentiation as in Figure 1f. (h) ATP levels in DIV6 cortical neurons treated for 24 h. Data represent mean±S.E.M. (n=3–4 of independent experiments; Student's t-test). MIF, mean fluorescence intensity
Figure 5
Figure 5
Glutamine–glutamate cycle increase during in vitro terminal differentiation of cortical neurons. (a) A schematic representation of Glutamine–glutamate pathway in cortical neurons. In red, the genes assayed. (b) Glutamate and GABA levels increase during cortical neuron differentiation. Levels of the indicated metabolites were evaluated as described in Materials and Methods section. Welch's two-sample t-tests were used to identify biochemicals that differed significantly between experimental groups (n=5 for each time point). (c and d) mRNA levels of glutaminase type 1 (GLS1), type 2 (GLS2) and glutamate dehydrogenase 1 (GLUD1) increase during differentiation of cortical neurons. Enzyme levels were evaluated by real-time PCR. Data are normalized to the housekeeping GAPDH and relative to DIV1. (e) Western blotting analysis of glutamate decarboxylase 67 (GAD67) along the differentiation of cortical neurons (f) Pharmacological inhibition of glutamine–glutamate pathway negatively affect cortical neuron differentiation. Cortical neurons were plated at DIV1 and untreated (CTRL) or treated with DON (10 μM) for 48 h. Representative micrographs of DIV3 cortical neurons stained with β-III-Tubulin are shown. (g) Quantification of neuronal differentiation as in Figure 1f. (h) ATP levels in DIV6 cortical neurons treated for 24 h. Data represent mean±S.E.M. (n=3 of independent experiments; Student's t-test)
Figure 6
Figure 6
PI3K–Akt–mTOR signalling regulates mitochondrial bioenergetics and glucose uptake. (a) Immunoblot of S6K phosphorylation in control (Ctrl) and rapamycin-treated (RAPA) cortical neurons. A representative experiment is shown (n=3). (b) A representative confocal images of cortical neurons at DIV5 after rapamycin treatment showing a reduction of neuronal differentiation. After treatment, neurons were fixed and immunostained with β-III-Tubulin and DAPI. (c) A representative western blotting showing the levels of the indicated proteins. DIV1 cortical neurons were treated as indicated (RAPA=rapamycin 10 nM; LY294002=50 μM; PD98059=25 μM) and harvested at DIV5. (d) Relative levels of mtDNA analysed by real-time PCR of cortical neurons treated as in panel (c). (e and f) Mitochondrial maximal respiration and spare respiratoty capacity is regulated by the PI3K–Akt–mTOR pathway. Cortical neurons treated as in panel (b) were analysed using the XF24 Analyser (see Materials and Methods section for details). (g) PI3K–Akt–mTOR pathway is involved in the regulation of glucose uptake. Data represent mean±S.E.M. (n=3 of independent experiments; Student's t-test)
Figure 7
Figure 7
Role of ROS in terminal neuronal differentiation. (ac) GSSG levels increase during cortical neurons differentiation. Levels of the indicated metabolites were evaluated as described in Materials and Methods section. Welch's two-sample t-tests were used to identify biochemicals that differed significantly between experimental groups (n=5 for each time point). (d) ROS levels during cortical neuron differentiation were assayed with CM-DCFDA by FACS analysis, Values are mean±S.D. (n=3 independent experiments). (e) Inhibition of ROS levels by NAC negatively affect neuronal differentiation evaluated by Synapsin expression. (f) ROS levels in DIV7 cortical neurons derived from GCLM−/− mice (n=3). ROS were evaluated with CM-DCFDA by FACS analysis. (g) Basal respiration is increased in DIV7 cortical neurons derived from GCLM−/− mice. Cortical neurons were analysed using the XF24 Analyser (see Materials and Methods section for details). (h) Western blotting analysis of the indicated proteins in DIV7 cortical neurons from GCLM−/−, WT and Het mice. A representative experiment is shown. Syn, Synapsin 1–2
Figure 8
Figure 8
Schematic summary of the metabolic changes during terminal neuronal differentiation. Differentiation of primary cortical neurons is associated with increased mitochondrial biogenesis, glycolysis and glutaminolysis. Glycolysis is associated, at least in part, with an increased expression of GLUT3 and PFKp. Increased glutamine metabolism is partly due to an increased expression of enzymes, such as GLS1 and GLS2. Changes in mitochondrial mass, morphology and function were correlated with the upregulation of the master regulators of mitochondrial biogenesis, TFAM and PGC-1α. Differentiation requires a significant increased mitochondrial mass and function, secondary to activation of the PI3K/mTOR axis. Please see Discussion section for further details

References

    1. Attwell D, Laughlin SB. An energy budget for signaling in the grey matter of the brain. J Cereb Blood Flow Metab 2001; 21: 1133–1145. - PubMed
    1. McKenna MC. The glutamate-glutamine cycle is not stoichiometric: fates of glutamate in brain. J Neurosci Res 2007; 85: 3347–3358. - PubMed
    1. Erecinska M, Zaleska MM, Nissim I, Nelson D, Dagani F, Yudkoff M. Glucose and synaptosomal glutamate metabolism: studies with [15 N]glutamate. J Neurochem 1988; 51: 892–902. - PubMed
    1. Sonnewald U, McKenna M. Metabolic compartmentation in cortical synaptosomes: influence of glucose and preferential incorporation of endogenous glutamate into GABA. Neurochem Res 2002; 27: 43–50. - PubMed
    1. Chang DT, Reynolds IJ. Differences in mitochondrial movement and morphology in young and mature primary cortical neurons in culture. Neuroscience 2006; 141: 727–736. - PubMed

MeSH terms