. 2016 Apr 7;165(2):357-71.
doi: 10.1016/j.cell.2016.02.036.

RNA Polymerase II Regulates Topoisomerase 1 Activity to Favor Efficient Transcription

Affiliations

RNA Polymerase II Regulates Topoisomerase 1 Activity to Favor Efficient Transcription

Laura Baranello et al. Cell. .

Abstract

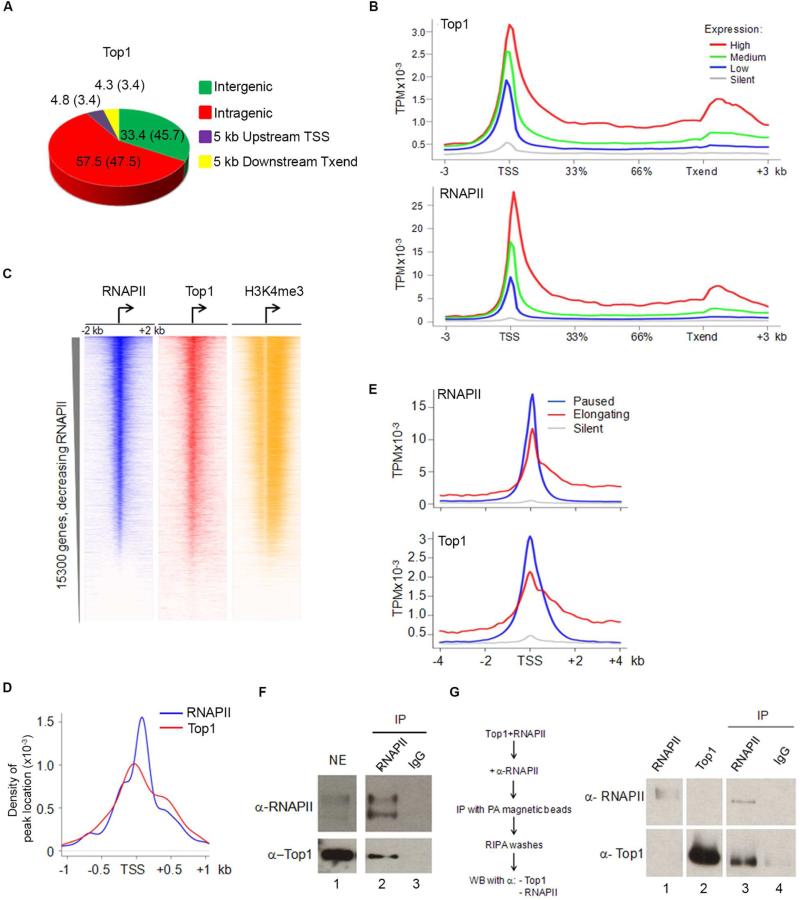
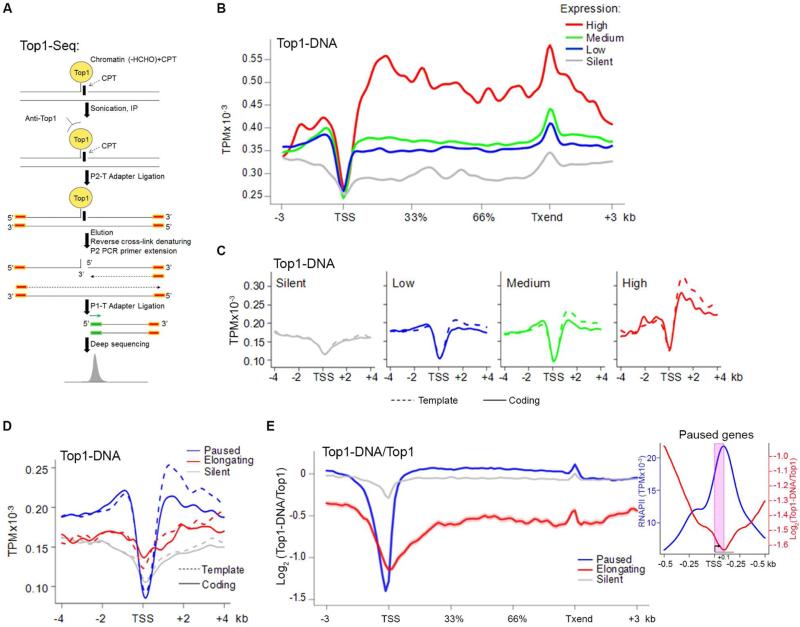
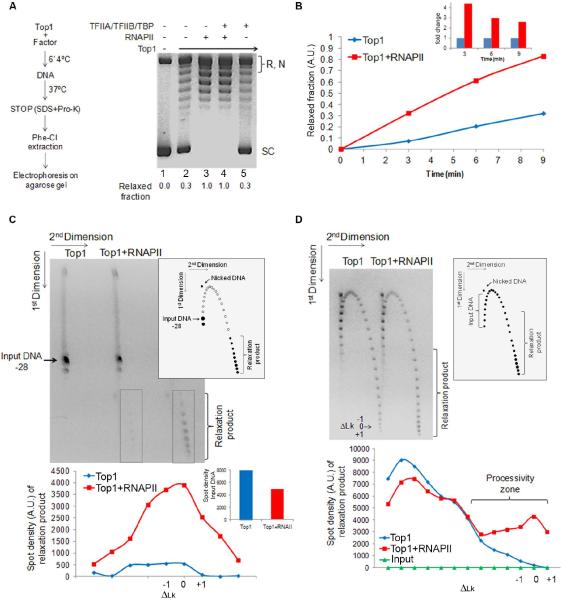
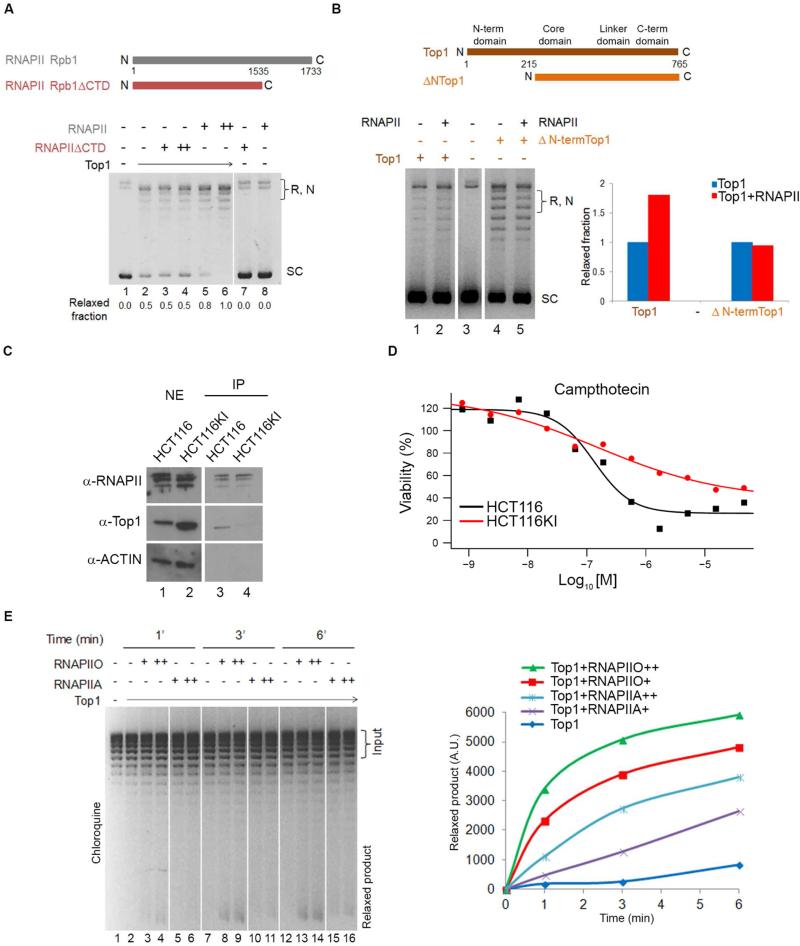
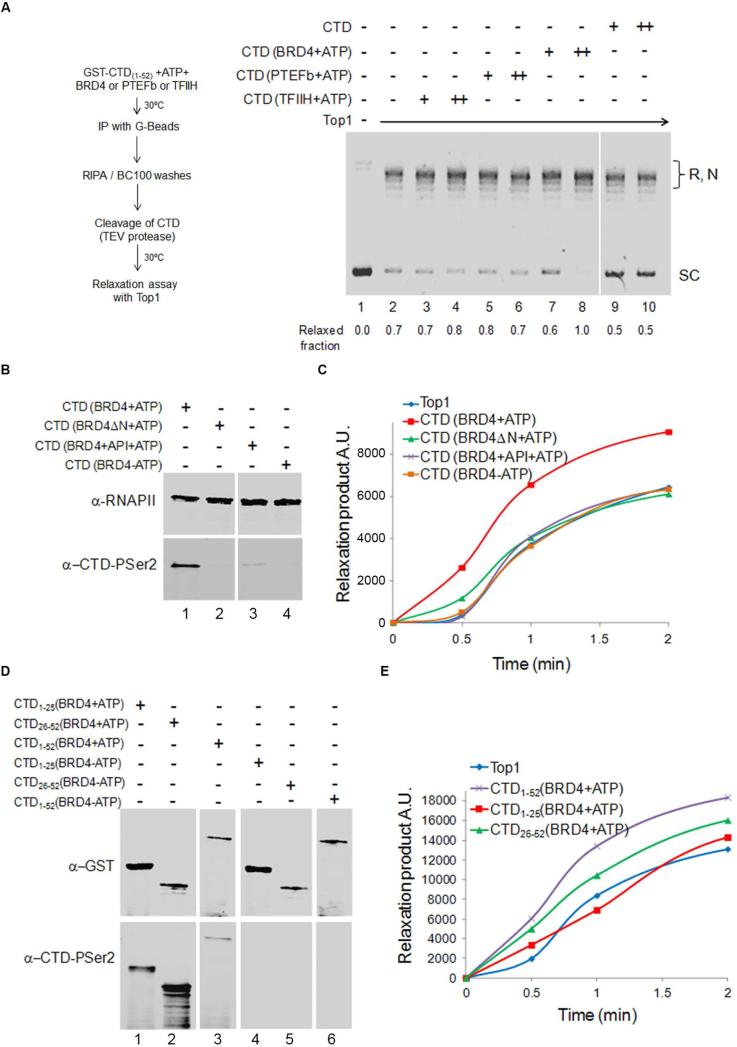
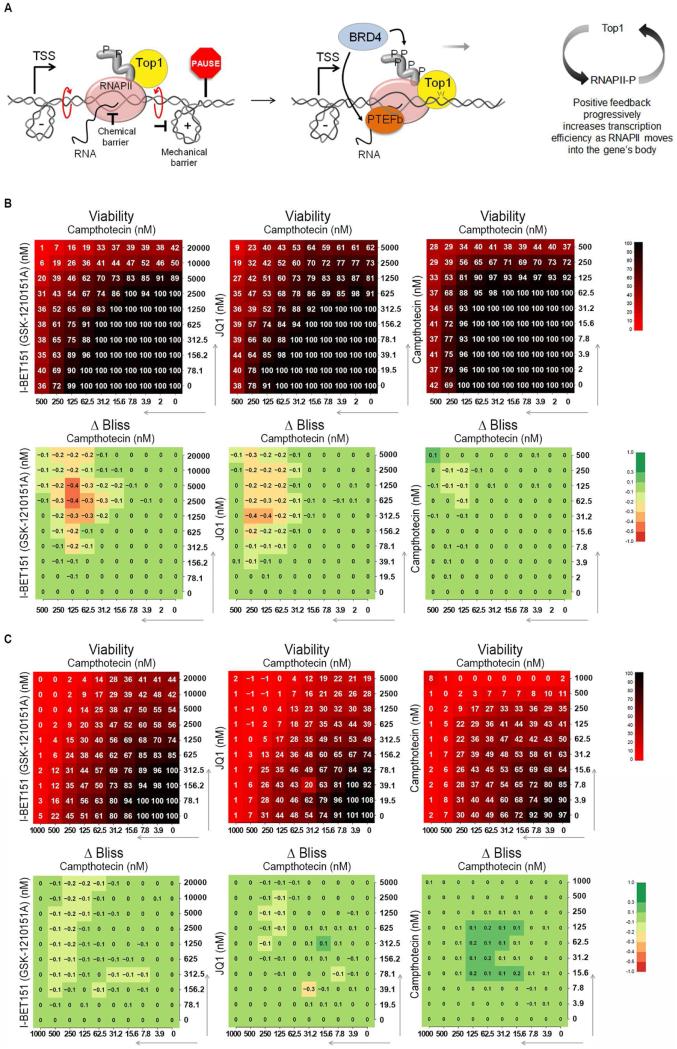
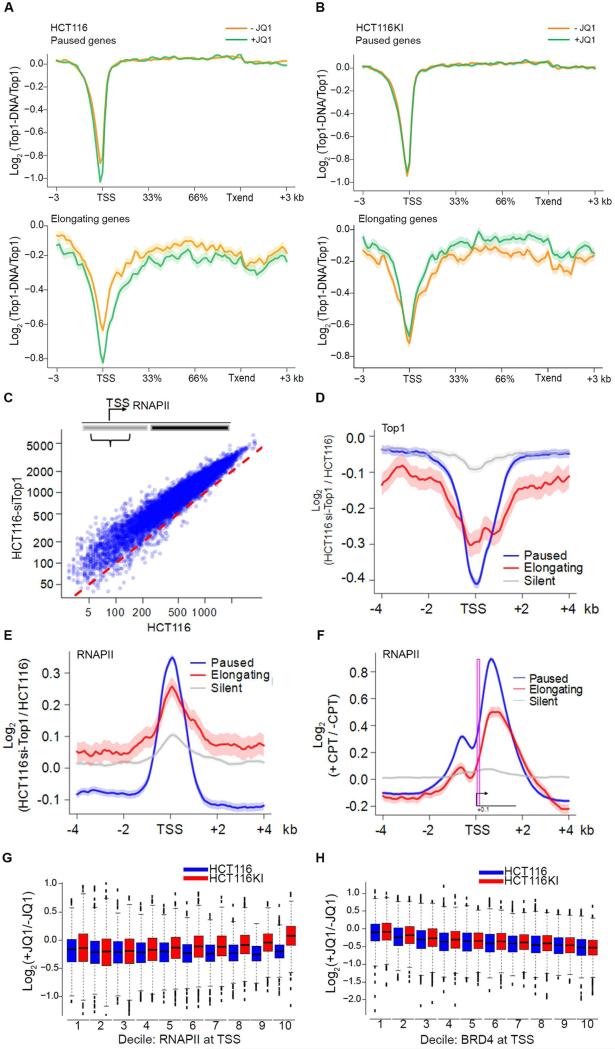
We report a mechanism through which the transcription machinery directly controls topoisomerase 1 (TOP1) activity to adjust DNA topology throughout the transcription cycle. By comparing TOP1 occupancy using chromatin immunoprecipitation sequencing (ChIP-seq) versus TOP1 activity using topoisomerase 1 sequencing (TOP1-seq), a method reported here to map catalytically engaged TOP1, TOP1 bound at promoters was discovered to become fully active only after pause-release. This transition coupled the phosphorylation of the carboxyl-terminal-domain (CTD) of RNA polymerase II (RNAPII) with stimulation of TOP1 above its basal rate, enhancing its processivity. TOP1 stimulation is strongly dependent on the kinase activity of BRD4, a protein that phosphorylates Ser2-CTD and regulates RNAPII pause-release. Thus the coordinated action of BRD4 and TOP1 overcame the torsional stress opposing transcription as RNAPII commenced elongation but preserved negative supercoiling that assists promoter melting at start sites. This nexus between transcription and DNA topology promises to elicit new strategies to intercept pathological gene expression.


Figures

Figure 1
Figure 1. TOP1 Functionally and Physically Associates With the Transcriptional Machinery
A) TOP1 occupancy in HCT116 cells. +5Kb and −5Kb indicate tags within 5Kb upstream of TSS or downstream of Txend respectively; numbers in parenthesis are values expected if randomly distributed. B) TOP1 and RNAPII occupancy (as sequence tags per million, TPM) across genes classified by expression. C) Heat map of RNAPII, TOP1 and H3k4me3 near TSSs of human protein coding genes ranked from highest to lowest RNAPII level. D) Density distribution of RNAPII and TOP1 peaks around TSSs identified by QuEST. E) RNAPII and TOP1 distribution around TSSs for elongating, paused and silent genes. F) Nuclear extracts and G) recombinant proteins immunoprecipitated with anti-RNAPII or non-immune IgG and probed for TOP1 and RNAPII. See also Figure S1
Figure 2
Figure 2. TOP1 Is Active Along Gene Bodies
A) TOP1-Seq. B) TOP1-Seq profile at genes ranked by expression. C) Strand-specific TOP1-Seq around TSSs ranked by gene expression. D) Strand-specific TOP1-Seq at TSSs for paused, elongating and silent genes. E) Log-ratio of tags of TOP1-Seq and TOP1 ChIP-Seq across gene bodies. Shaded area indicates s.e.m. Inset. RNAPII density and TOP1 relative activity at paused promoters. TSS/pause region is shaded (pink). See also Figure S1.
Figure 3
Figure 3. RNAPII Stimulates TOP1 Activity Above Its Intrinsic Rate
A) TOP1 alone or pre-incubated with RNAPII and/or general transcription factors TFIIA/TFIIB/TBP before plasmid DNA was added. Plasmid relaxation was checked by agarose gel electrophoresis. Supercoiled bands (SC) were quantified and compared to SC without TOP1 (1st lane). Numbers indicate relaxed fraction. R – relaxed DNA. N – nicked DNA. B) TOP1 was incubated on ice with or without RNAPII before addition of DNA. The graph shows the relaxed fraction. The inset shows the fold stimulation. C) The right diagram shows schematic trajectory of topoisomers in 2D gel (Extended Experimental Procedures). Filled circles indicate experimentally observed species. Unreacted −28 ΔLk topoisomer substrate and relaxed product topoisomers are indicated. Left. Distribution of product DNA topoisomers after incubation with TOP1 with or without RNAPII. Bottom panel quantifies spot distribution (relaxation product is indicated by grey boxes). Inset shows spot quantification of unreacted −28 ΔLk DNA topoisomer. D) Reactions performed as in C but the substrate was a population of supercoiled topoisomers in increased ionic strength buffer (Extended Experimental Procedures). See also Figure S2.
Figure 4
Figure 4. Phosphorylated CTD of RNAPII Stimulates TOP1
A) Upper panel. Representation of RPB1 subunit of RNAPII and a version lacking the CTD. Lower panel. TOP1 was pre-incubated alone or in combination with RNAPII or CTD-minus RNAPII. After relaxation, DNA was run under native conditions. Numbers quantify the relaxed fraction. B) Upper panel. Domain structure of the human TOP1 and of a truncated form lacking the NTD. Lower panel. Full length TOP1 and ΔN-term TOP1 were pre-incubated on ice with or without RNAPII. Relaxation assay and gel electrophoresis were performed as in A). Relevant lanes from the same gel were juxtaposed. The graph quantifies relaxation. C) Nuclear extracts from HCT116 and HCT116KI cells immunoprecipitated with anti-RNAPII and probed for TOP1 and RNAPII. ACTIN was used to assess non-specific binding. D) HCT116 and HCT116KI cells were treated with serial dilutions of TOP1 inhibitor CPT and viability was measured. E) RNAPIIA and RNAPIIO were pre-incubated with TOP1 then plasmid was added. Relaxation products were run in the presence of chloroquine and quantified as shown in graph. See also Figure S3 and S4.
Figure 5
Figure 5. BRD4-phosphorylated RNAPII-CTD Stimulates TOP1 Relaxation
A) GST-CTD(1-52) was phosphorylated with TFIIH, PTEF-b or BRD4, purified and co-incubated with TOP1 for plasmid relaxation. Numbers quantify relaxed fraction. B) GST-CTD(1-52) was phosphorylated with BRD4 plus (lane 1) or minus (lane 4) ATP, with kinase inhibitor apigenin (API, lane 3) or a BRD4 kinase mutant (BRD4ΔN, lane 2) was used. Reactions were immunoblotted for total RNAPII and phospho-Ser 2 CTD. After purification, CTDs were co-incubated with TOP1. Quantification of relaxation is graphed. D) GST-CTD(1-52), ,GST-CTD(1-25) and GST-CTD(26-52) were phosphorylated with BRD4 in presence (lanes 1, 2, 3) or absence (lanes 4, 5, 6) of ATP. Reactions were immunoblotted for GST and phospho-Ser2 CTD. After purification CTDs were co-incubated with TOP1 (E). Relaxation products were run and analyzed as in C). The graph shows quantification of relaxation. Relevant lanes from the same gel were juxtaposed. See also Figure S4 and S5.
Figure 6
Figure 6. CPT Synergizes With BET Inhibitors in Killing HCT116 Cells
A) Model. DNA supercoiling imposes a mechanical barrier to the progression of RNAPII and contributes to arrest at pause site. CTD phosphorylation stimulates TOP1 to relieve torsional stress and assist pause-release. Through a second arm, BRD4 activates the transcription machinery via PTEF-b. B) Combination response to BRD4 inhibitors I-BET151 or JQ1 with TOP1 inhibitor CPT and a self-cross of CPT. Negative values indicate synergy (Extended Experimental Procedures). C) As in B) but experiment performed on HCT116KI. See also Figure S6.
Figure 7
Figure 7. TOP1 Knockdown or Inhibition Elicit RNAPII Accumulation at TSSs
A) HCT116 cells were treated with JQ1. The Log-ratio of tag profiles of TOP1-Seq and TOP1 ChIP-Seq across paused and elongating genes is shown. B) Same as A) but experiment performed on HCT116KI. C) Scatter plot showing change of RNAPII density at TSS between HCT116 and HCT116-siTOP1 cells (Wilcoxon rank-sum test, p-value < e-200). D) Relative TOP1 and E) RNAPII levels at TSSs. The curves show the average Log enrichment ratio of tag profiles in HCT116-siTOP1 versus HCT116 cells. F) Relative RNAPII levels at TSSs of elongating, paused and silent genes. The curves show average Log enrichment ratios of tag profiles in HCT116 treated or not with CPT. The TSS/pause region is boxed to show increased RNAPII there. G) Relative RNAPII levels at TSS. TSSs were sorted in deciles according to increasing levels of RNAPII. Log ratio of tag profiles in HCT116 and HCT116KI cells treated or not with JQ1 is shown. H) Same as G) but analysis was made with BRD4. See also Figure S7.

References

    1. Adelman K, Lis JT. Promoter-proximal pausing of RNA polymerase II: emerging roles in metazoans. Nature reviews Genetics. 2012;13:720–731. - PMC - PubMed
    1. Amente S, Gargano B, Napolitano G, Lania L, Majello B. Camptothecin releases P-TEFb from the inactive 7SK snRNP complex. Cell Cycle. 2009;8:1249–1255. - PubMed
    1. Baranello L, Kouzine F, Wojtowicz D, Cui K, Przytycka TM, Zhao K, Levens D. DNA break mapping reveals topoisomerase II activity genome-wide. International journal of molecular sciences. 2014;15:13111–13122. - PMC - PubMed
    1. Baranello L, Levens D, Gupta A, Kouzine F. The importance of being supercoiled: how DNA mechanics regulate dynamic processes. Biochimica et biophysica acta. 2012;1819:632–638. - PMC - PubMed
    1. Barski A, Cuddapah S, Cui K, Roh TY, Schones DE, Wang Z, Wei G, Chepelev I, Zhao K. High-resolution profiling of histone methylations in the human genome. Cell. 2007;129:823–837. - PubMed

Publication types

MeSH terms