. 2016 Jun 1;310(11):H1735-47.
doi: 10.1152/ajpheart.00109.2016. Epub 2016 Apr 8.

Inhibition of endothelial nitric oxide synthase decreases breast cancer cell MDA-MB-231 adhesion to intact microvessels under physiological flows

Affiliations

Inhibition of endothelial nitric oxide synthase decreases breast cancer cell MDA-MB-231 adhesion to intact microvessels under physiological flows

Lin Zhang et al. Am J Physiol Heart Circ Physiol. .

Abstract

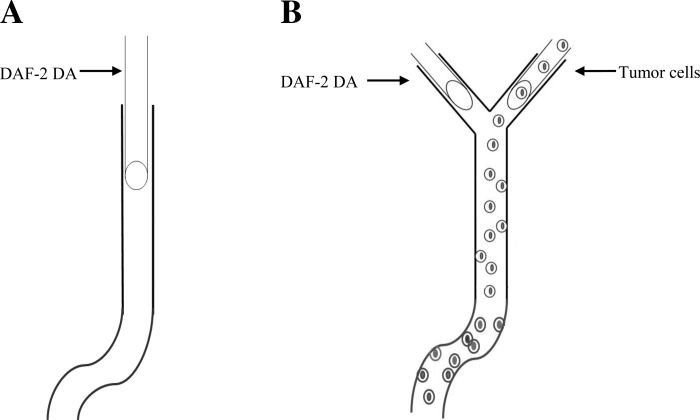
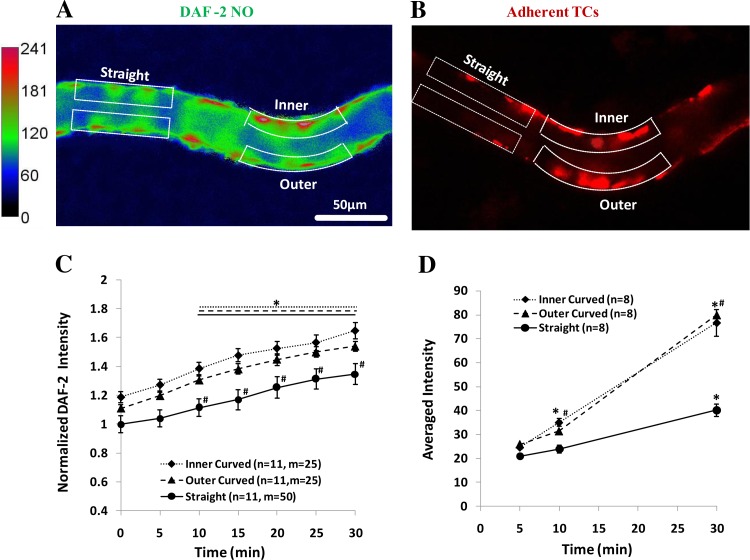
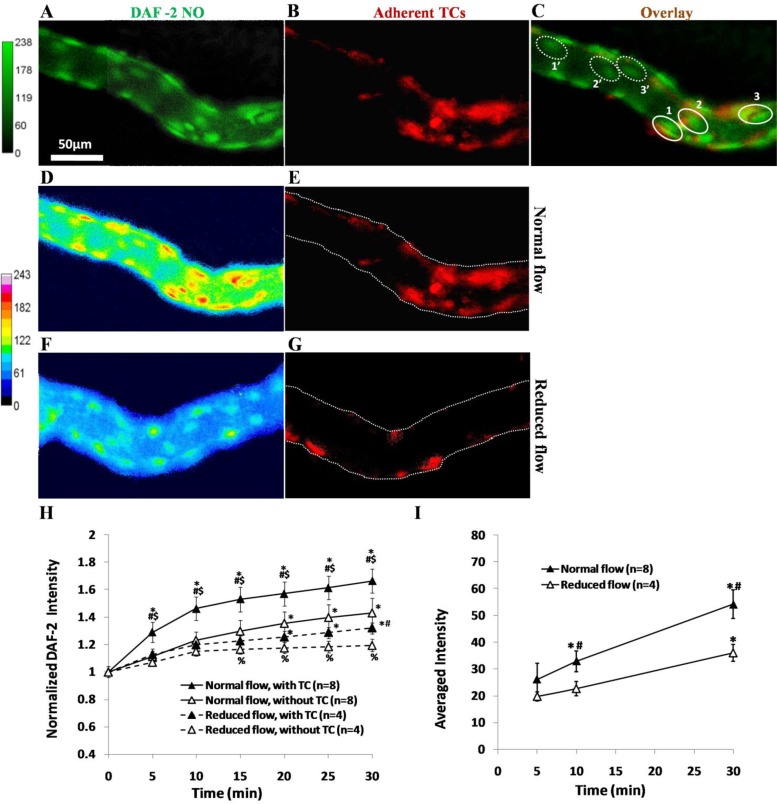
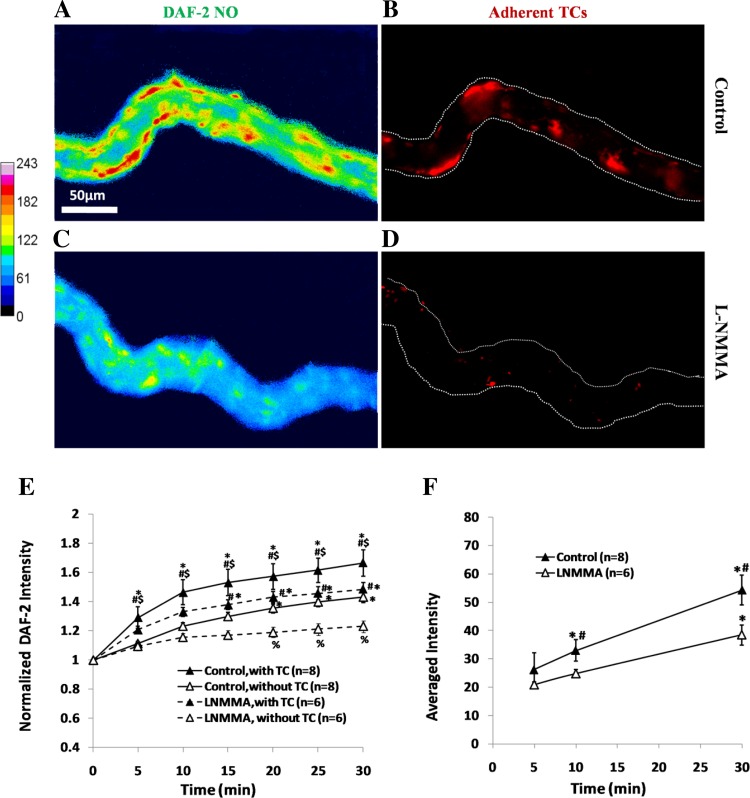
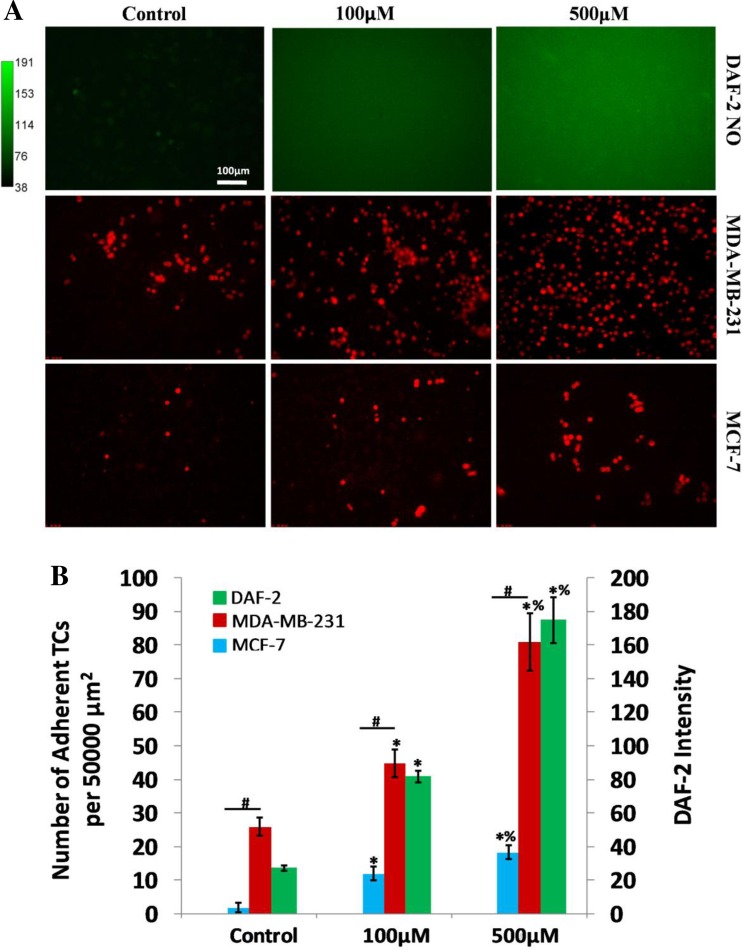
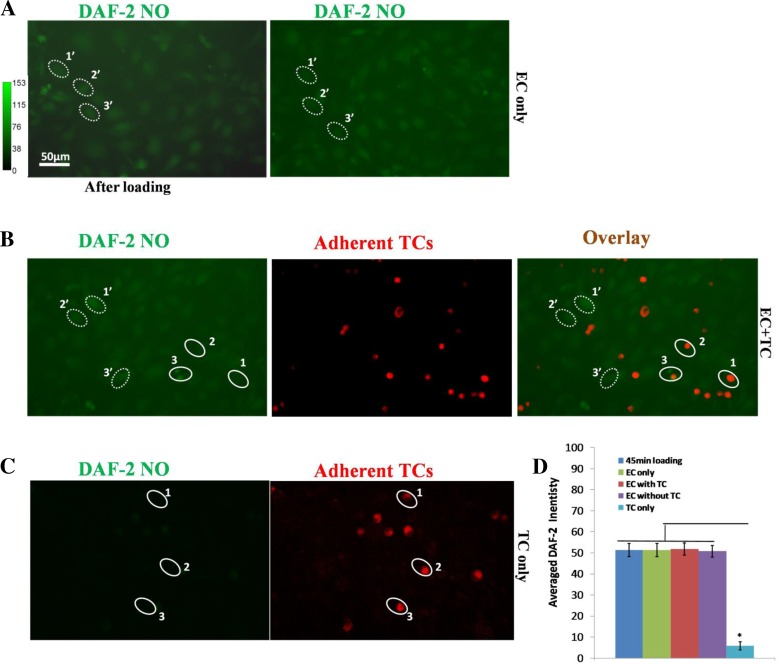
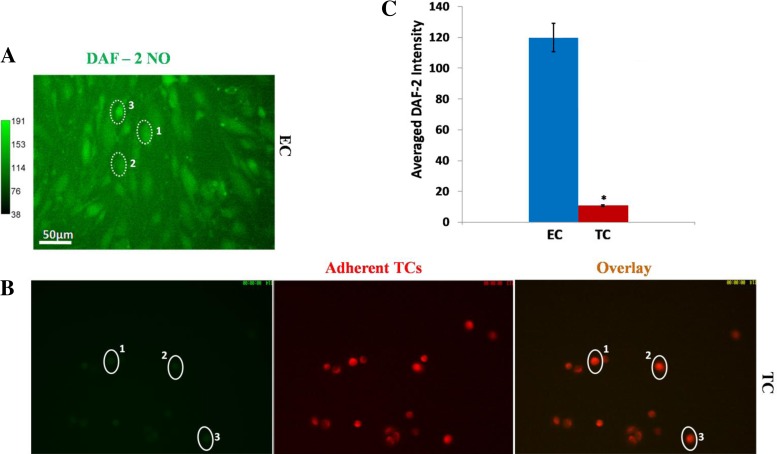
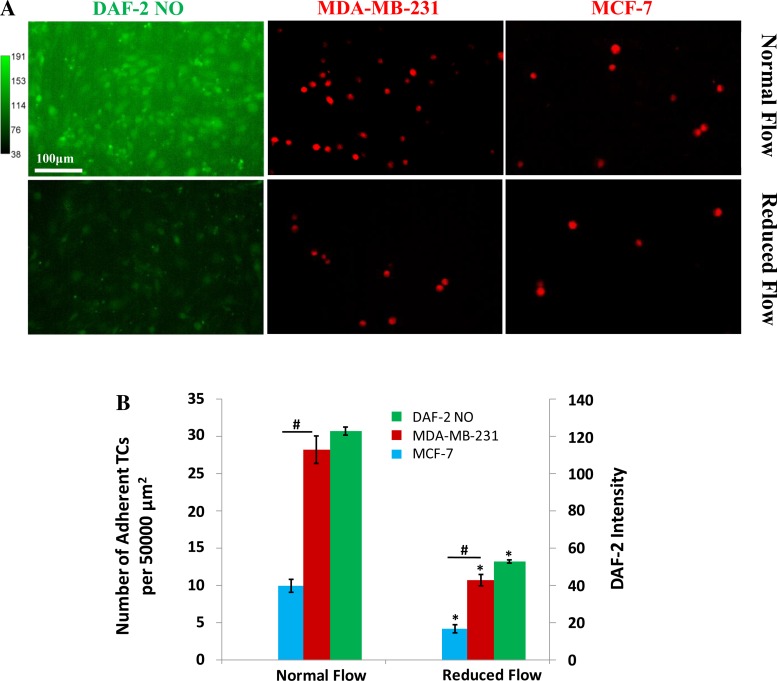
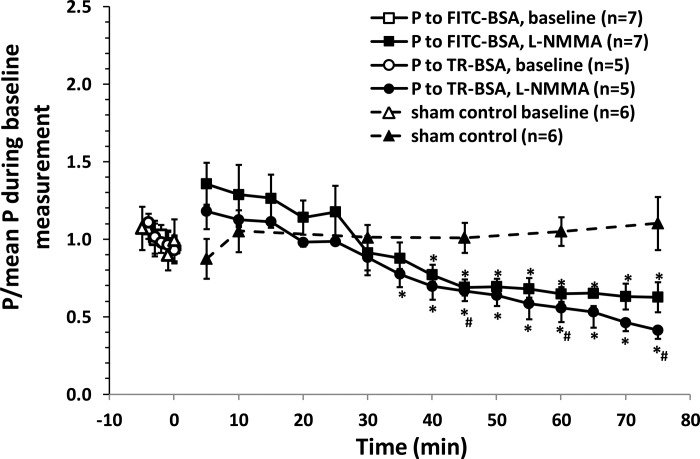
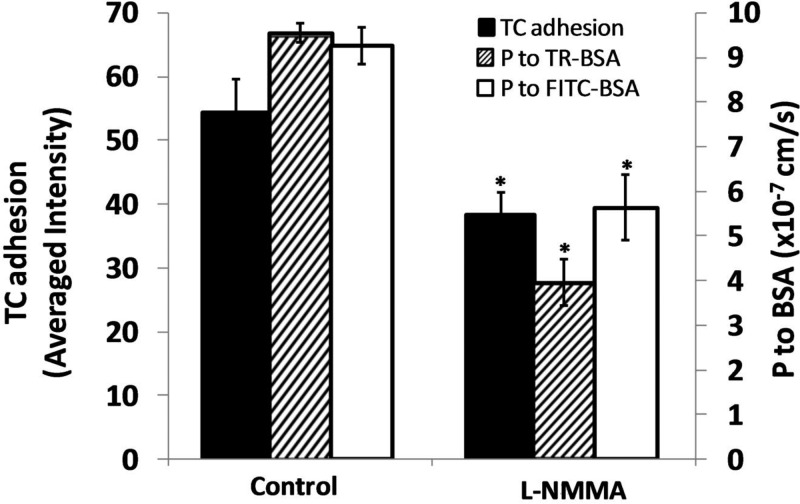
Nitric oxide (NO) at different concentrations may promote or inhibit tumor growth and metastasis under various conditions. To test the hypothesis that tumor cells prefer to adhere to the locations with a higher endothelial NO production in intact microvessels under physiological flows and to further test that inhibiting NO production decreases tumor cell adhesion, we used intravital fluorescence microscopy to measure NO production and tumor cell adhesion in postcapillary venules of rat mesentery under normal and reduced flow conditions, and in the presence of an endothelial nitric oxide synthase (eNOS) inhibitor, N(G)-monomethyl-l-arginine (l-NMMA). Rats (SD, 250-300 g) were anesthetized. A midline incision (∼2 inch) was made in the abdominal wall, and the mesentery was taken out from the abdominal cavity and spread over a coverslip for the measurement. An individual postcapillary venule (35-50 μm) was first loaded with 4,5-diaminofluorescein diacetate (DAF-2 DA), a fluorescent indictor for NO. Then the DAF-2 intensity was measured for 30 min under a normal or reduced flow velocity, with and without perfusion with MDA-MB-231 breast cancer cells, and in the presence of l-NMMA. We found that tumor cells prefer to adhere to the microvessel locations with a higher NO production such as curved portions. Inhibition of eNOS by l-NMMA attenuated the flow-induced NO production and reduced tumor cell adhesion. We also found that l-NMMA treatment for ∼40 min reduced microvessel permeability to albumin. Our results suggest that inhibition of eNOS is a good approach to preventing tumor cell adhesion to intact microvessels under physiological flows.

Keywords: NG-monomethyl-l-arginine; curved and straight portions; flow-induced nitric oxide production; microvessel permeability to albumin; postcapillary venule in rat mesentery.


Figures

Fig. 1.
Fig. 1.
Schematic showing the technique used to measure nitric oxide (NO) production in the endothelial cells forming the microvessel wall with and without tumor cell perfusion. A: without tumor cell perfusion. A postcapillary venule of 500∼1000 μm long with straight and curved portions is cannulated with a micropipette and loaded with 4,5-diaminofluorescein diacetate (DAF-2 DA; 5 μM) in 1% BSA-Ringer solution for 45 min at a reduced perfusion rate of ∼300 μm/s; DAF-2 NO images of the microvessel are then taken every 5 min up to 30 min under a perfusion rate of ∼1,000 μm/s (normal flow) or ∼300 μm/s (reduced flow). B: with tumor cell perfusion. A postcapillary venule of 500∼1,000 μm long with straight and curved portions and with a Y-branch at its upstream is found first. One branch is cannulated and loaded with DAF-2 DA (5 μM) in 1% BSA-Ringer solution for 45 min at a reduced perfusion rate of ∼300 μm/s while another branch is occluded by a glass pipette blocker. At the end of 45 min, the branch vessel for DAF-2 DA loading is blocked and another branch is cannulated and perfused with cell tracker red-labeled tumor cells in 1% BSA-Ringer solution at a normal or reduced rate. Every 5 min up to 30 min, DAF-2 NO and tumor cell adhesion images of the vessel are then taken alternately by switching the light to green (excitation 490/emission 520 nm] for DAF-2 NO and to red (excitation 577/emission 602 nm) for tumor cells.
Fig. 2.
Fig. 2.
Images for endothelial NO production (A) and tumor cell (TC) adhesion (B) along microvessels with straight and curved portions after 30 min perfusion at normal flow. The focus is on the midplane of the vessel. In A, the microvessel is perfused without tumor cells. The intensity scale bar at left is for the DAF-2 NO. The region of interests (ROIs) for the curved portion has 2 locations, the inner and outer curved ROI, which is the white dotted line-enclosed region with the length of 50–100 μm and the width of 10–15 μm along the vessel border. Correspondingly, there are straight portions (2 ROIs for each portion) of the equal size and number in the same vessel. In B, the microvessel is perfused with tumor cells. The red spots are adherent tumor cells labeled with cell tracker red. The ROIs for adherent tumor cells are the same as those defined for the DAF-2 NO. For each vessel, there are 2 to 3 curved portions and 2 to 3 straight portions. C: normalized DAF-2 NO intensity as a function of time during 30 min perfusion under normal flow for the inner and outer curved part and the straight portion in microvessels without tumor cell perfusion. *P < 0.05, compared NO production with that at the end of DAF-2 DA loading (t = 0); #P < 0.05, compared NO production between straight and curved portions at the same time. D: averaged fluorescent intensity for adherent tumor cells as a function of time during 30 min perfusion under normal flow at the inner and outer curved part and the straight portion in the microvessels. *P < 0.05, compared TC adhesion with that at 5 min; #P < 0.05, compared TC adhesion between straight and curved portions at the same time; n, number of vessels; m, number of ROIs. Values are means ± SE.
Fig. 3.
Fig. 3.
A representative experiment showing endothelial NO production (A) and tumor cell (TC) adhesion (B) along the same microvessel after 30 min perfusion under normal flow. The focus is on a focal plane for endothelial cells (ECs) near the bottom of the vessel. C: overlay of A and B. In C, we define 3 typical ROIs, solid line-enclosed oval-shaped regions 1, 2, and 3, for NO production in ECs with adherent TCs, and 3 ROIs, dotted line-enclosed regions 1′, 2′, and 3′ for NO production in ECs without adherent TCs in the same vessel. The ROI is an oval-shaped area with ∼40 μm for the long axis and 25 μm for the short axis. For a vessel with 350–550 μm focused length, there are 12–18 ROIs with adherent TCs and equal amount of ROIs without TCs under normal flow, and a total of 123 ROIs with adherent TCs in 8 vessels. Under the reduced flow, there are only 8–12 ROIs with adherent TCs in each vessel with a total of 38 ROIs with adherent TCs in 4 vessels. Endothelial NO production and TC adhesion along the same microvessel after 30 min perfusion under normal flow (D and E) and under the reduced flow (F and G) are shown. H: comparison of temporal NO production profiles in ECs with adherent TCs (▲) and those without adherent TCs (△) in the same vessels under normal (solid line) and reduced (dashed line) flows. *P < 0.05, compared with that at the end of DAF-2 DA loading (t = 0); #P < 0.05, compared NO production in the ECs with adherent TCs and those without in the same vessel at the same time; $P < 0.05, compared NO production in the ECs with adherent TCs under normal and reduced flows at the same time; %P < 0.05, compared NO production in the ECs without adherent TCs under normal and reduced flows at the same time. I: comparison of temporal TC adhesion profiles under normal and reduced flows. *P < 0.05, compared TC adhesion with that at 5 min; #P < 0.05, compared TC adhesion under normal and reduced flows at the same time; n, number of vessels. Values are means ± SE.
Fig. 4.
Fig. 4.
Endothelial NO production and TC adhesion along the same microvessel after 30 min perfusion under control (A and B) and under NG-monomethyl-l-arginine (l-NMMA) treatment (C and D) under normal flow. The focus is on a focal plane for endothelial cells (ECs) near the bottom of the vessel. With the same definitions for ROIs with and without adherent TCs as in Fig. 3C, there are 8–12 ECs with TC adhesion and the same amount of ROIs without TC adhesion in each vessel with l-NMMA treatment, and a total of 58 ECs with TC adhesion in 6 vessels. E: comparison of temporal NO production profiles in ECs with adherent TCs (▲) and those without adherent TCs (△) in the same vessels under control (solid line) and l-NMMA treatment (dashed line). *P < 0.05, compared with that at the end of DAF-2 DA loading (t = 0); #P < 0.05, compared NO production in the ECs with adherent TCs and those without in the same vessel at the same time; $P < 0.05, compared NO production in the ECs with adherent TCs under control and l-NMMA treatment at the same time; %P < 0.05, compared NO production in the ECs without adherent TCs under control and l-NMMA treatment at the same time. F: comparison of temporal TC adhesion profiles under control and l-NMMA treatment. *P < 0.05, compared TC adhesion with that at 5 min; #P < 0.05, compared TC adhesion under control and l-NMMA treatment at the same time; n, number of vessels. Values are means ± SE.
Fig. 5.
Fig. 5.
Effects of a NO donor, sodium nitroprusside (SNP), on EC NO production and TC adhesion in cultured bEnd3 monolayers. A: first row shows DAF-2 NO images in bEnd3 monolayers under control and after 20 min treatment of 100 and 500 μM SNP, respectively; second row and third rows show adherent MDA-MB-231 and MCF-7 cells after 30 min adhesion on EC monolayers under control and after 100 and 500 μM SNP treatment, respectively. B: comparison of NO production in EC monolayers under control and after 20 min treatment of 100 and 500 μM SNP and corresponding TC adhesion. For each condition, 3 culture dishes were measured, and 4 regions of ∼750 × 560 μm were imaged in each dish. For NO production, the DAF-2 NO intensity was normalized by that under control condition. *P < 0.05, compared with control for TC adhesion and NO production, respectively; #P < 0.05, compared adhesion of MDA-MB-231 cells with that of MCF-7 cells; %P < 0.05, compared effect of 500 μM SNP with that of 100 μM SNP; n = 3. Values are means ± SE.
Fig. 6.
Fig. 6.
DAF-2 NO images under static conditions in bEnd3 monolayer with ECs only (A), in bEnd3 monolayer with adherent TCs (B), and in TCs only (C). Left image in A is that after 45-min DAF-2 DA loading, and right image is that for 30 min later. Left image in B is for DAF-2 NO 30 min after 45-min DAF-2 DA loading in bEnd3 monolayer with adherent TCs, middle image is for adherent TCs, and right image is the overlay of the left and middle images. Left image in C is for DAF-2 NO 30 min after 45-min DAF-2 DA loading in TCs, and the right one is for TCs. The dotted line-enclosed oval-shaped regions are ROIs (∼40 μm for the long axis and 25 μm for the short axis) for NO production quantification in ECs without adherent TCs and the same-sized solid line-enclosed ROIs for those in ECs with adherent TCs or that in TCs. Four regions of ∼750 × 560 μm were taken from each experiment. Twenty to thirty ROIs for each type were chosen on each region. D: comparison of NO production in ECs and TCs under static conditions. The averaged DAF-2 intensity is for the ROIs over 3 experiments for each case. *P < 0.05, compared NO production in TCs with that in ECs. Values are means ± SE.
Fig. 7.
Fig. 7.
DAF-2 NO images in ECs of bEnd3 monolayer (A) and TCs (B) under normal flow (or equivalent 3 dyn/cm2 wall shear stress) for 30 min. In B, the left image shows the DAF-2 NO image of TCs, the middle one shows the TCs, and the right one is the overlay of the left and middle images. Three typical ROIs, dotted- or solid line-enclosed oval-shaped regions (∼40 μm for the long axis and 25 μm for the short axis) 1, 2, 3 in A and B, are for NO production quantification in ECs and TCs. Three experiments were done for each cell type. Four regions of ∼750 × 560 μm were taken from each experiment. Seventy to eighty ROIs were chosen on each region. B: comparison of NO production in ECs and TCs under normal flow. The averaged DAF-NO intensity is for the ROIs over 3 experiments for each cell type. *P < 0.05, compared NO production in TCs with that in ECs. Values are means ± SE.
Fig. 8.
Fig. 8.
Comparison of adhesion of MDA-MB-231 cells with that of MCF-7 cells under normal and reduced flows. A: first column shows DAF-2 NO images in bEnd3 monolayers under normal and reduced flows, respectively; second and third columns show adherent MDA-MB-231 and MCF-7 cells after 30 min adhesion on EC monolayers under normal and reduced flows, respectively. B: comparison of NO production in EC monolayers under normal and reduced flows and corresponding TC adhesion. For each condition, 3 flow chambers were measured and 4 regions of ∼750 × 560 μm were imaged in each chamber. *P < 0.05, compared with control for TC adhesion and NO production, respectively; #P < 0.05, compared adhesion of MDA-MB-231 cells with that of MCF-7 cells; n = 3. Values are means ± SE.
Fig. 9.
Fig. 9.
Effect of l-NMMA treatment on microvessel permeability to albumin. *P < 0.05, compared with baseline; #P < 0.05, compared with sham control at the same time. Values are means ± SE. TR, Texas Red.
Fig. 10.
Fig. 10.
Summary of the effects of l-NMMA on microvessel permeability to albumin and MDA-MB-231 cell adhesion. *P < 0.05, compared with the control. The permeability shown was at 75 min post-l-NMMA treatment. TC adhesion was at 30 min after 45-min pretreatment of l-NMMA. TR, Texas Red.

Similar articles

Cited by

References

    1. Adamson RH, Liu B, Fry GN, Rubin LL, Curry FE. Microvascular permeability and number of tight junctions are modulated by cAMP. Am J Physiol Heart Circ Physiol 274: H1885–H1894, 1998. - PubMed
    1. Balligand JL, Feron O, Dessy C. eNOS activation by physical forces: from short-term regulation of contraction to chronic remodeling of cardiovascular tissues. Physiol Rev 89: 481–534, 2009. - PubMed
    1. Bates DO, Curry FE. Vascular endothelial growth factor increases hydraulic conductivity of isolated perfused microvessels. Am J Physiol Heart Circ Physiol 271: H2520–H2528, 1996. - PubMed
    1. Boo YC, Jo H. Flow-dependent regulation of endothelial nitric oxide synthase: role of protein kinases. Am J Physiol Cell Physiol 285: C499–C508, 2003. - PubMed
    1. Cai B, Fan J, Zeng M, Zhang L, Fu BM. Adhesion of malignant mammary tumor cells MDA-MB-231 to microvessel wall increases microvascular permeability via degradation of endothelial surface glycocalyx. J Appl Physiol (1985) 113: 1141–1153, 2012. - PMC - PubMed

Publication types

Substances

LinkOut - more resources