. 2016 Apr 8;108(8):djw030.
doi: 10.1093/jnci/djw030. Print 2016 Aug.

Co-option of Liver Vessels and Not Sprouting Angiogenesis Drives Acquired Sorafenib Resistance in Hepatocellular Carcinoma

Affiliations

Co-option of Liver Vessels and Not Sprouting Angiogenesis Drives Acquired Sorafenib Resistance in Hepatocellular Carcinoma

Elizabeth A Kuczynski et al. J Natl Cancer Inst. .

Abstract

Background: The anti-angiogenic Sorafenib is the only approved systemic therapy for advanced hepatocellular carcinoma (HCC). However, acquired resistance limits its efficacy. An emerging theory to explain intrinsic resistance to other anti-angiogenic drugs is 'vessel co-option,' ie, the ability of tumors to hijack the existing vasculature in organs such as the lungs or liver, thus limiting the need for sprouting angiogenesis. Vessel co-option has not been evaluated as a potential mechanism for acquired resistance to anti-angiogenic agents.

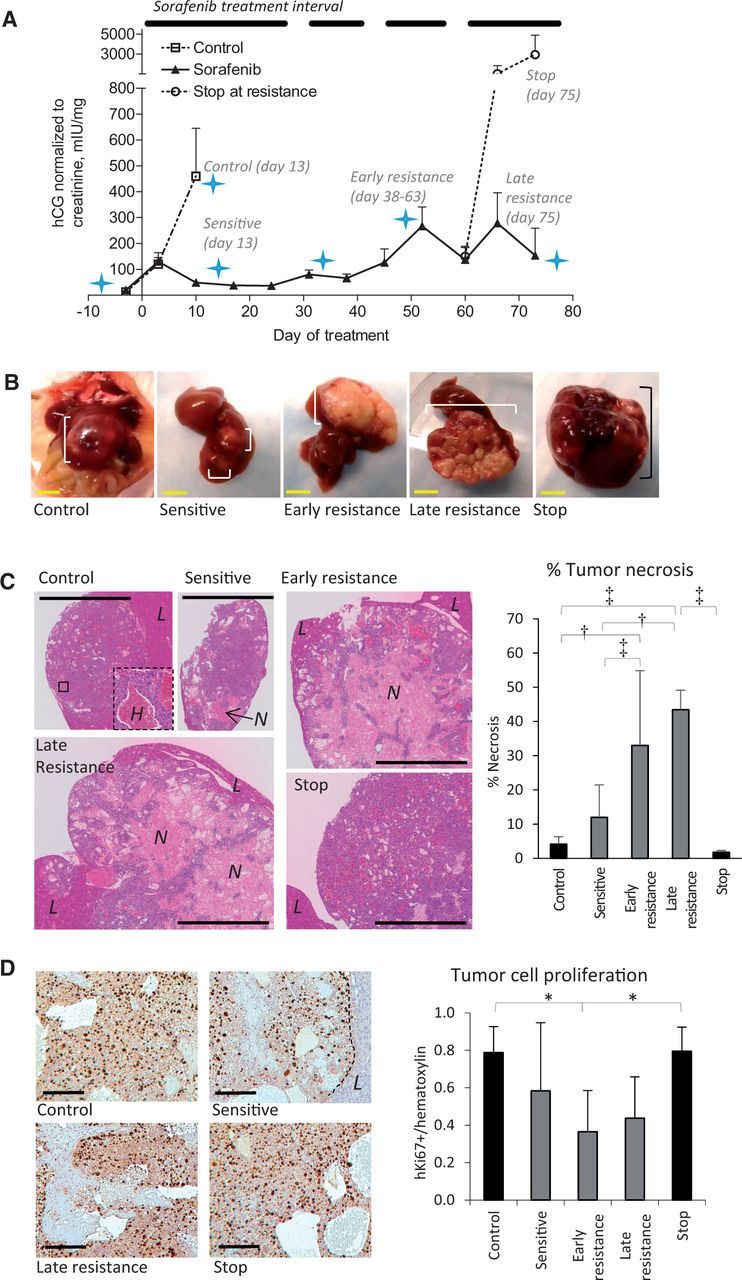
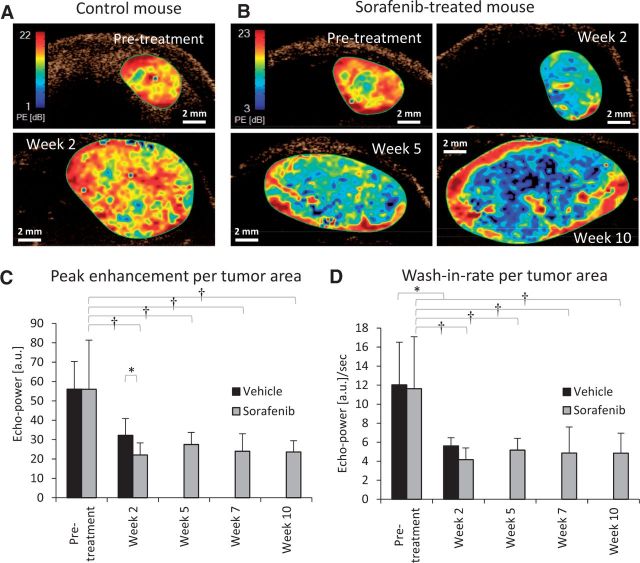
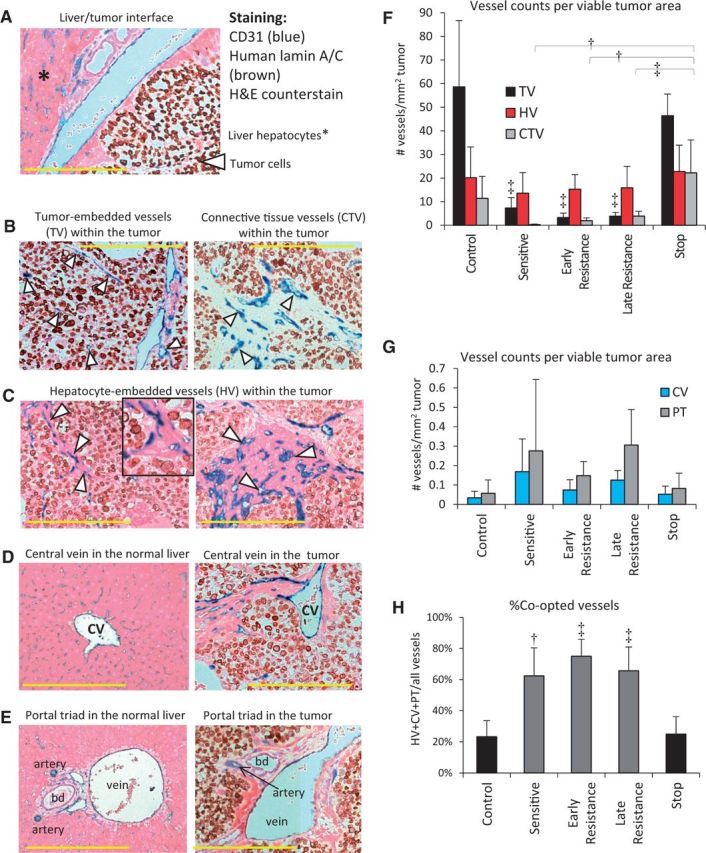
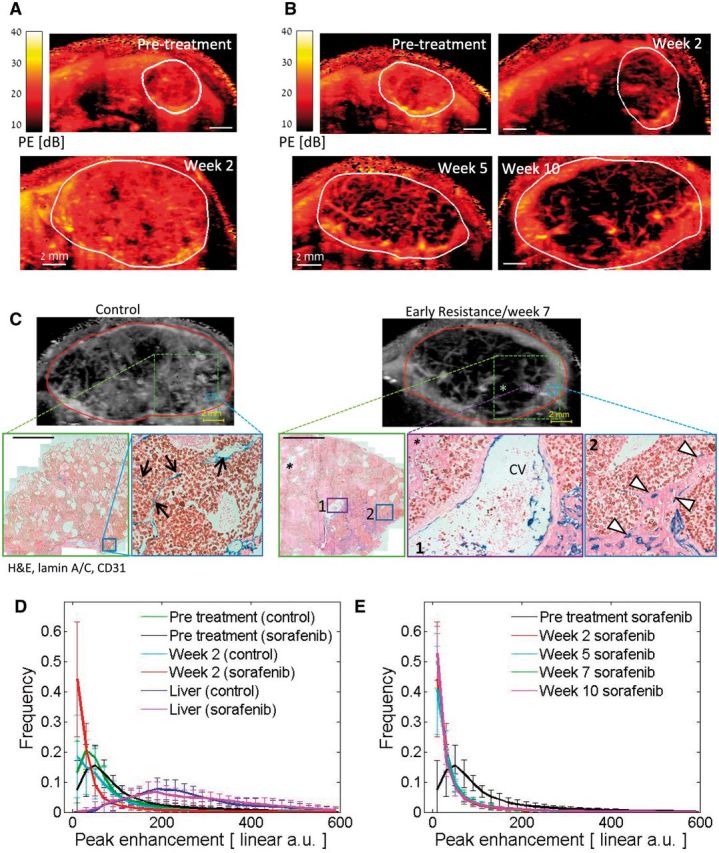
Methods: To study sorafenib resistance mechanisms, we used an orthotopic human HCC model (n = 4-11 per group), where tumor cells are tagged with a secreted protein biomarker to monitor disease burden and response to therapy. Histopathology, vessel perfusion assessed by contrast-enhanced ultrasound, and miRNA sequencing and quantitative real-time polymerase chain reaction were used to monitor changes in tumor biology.

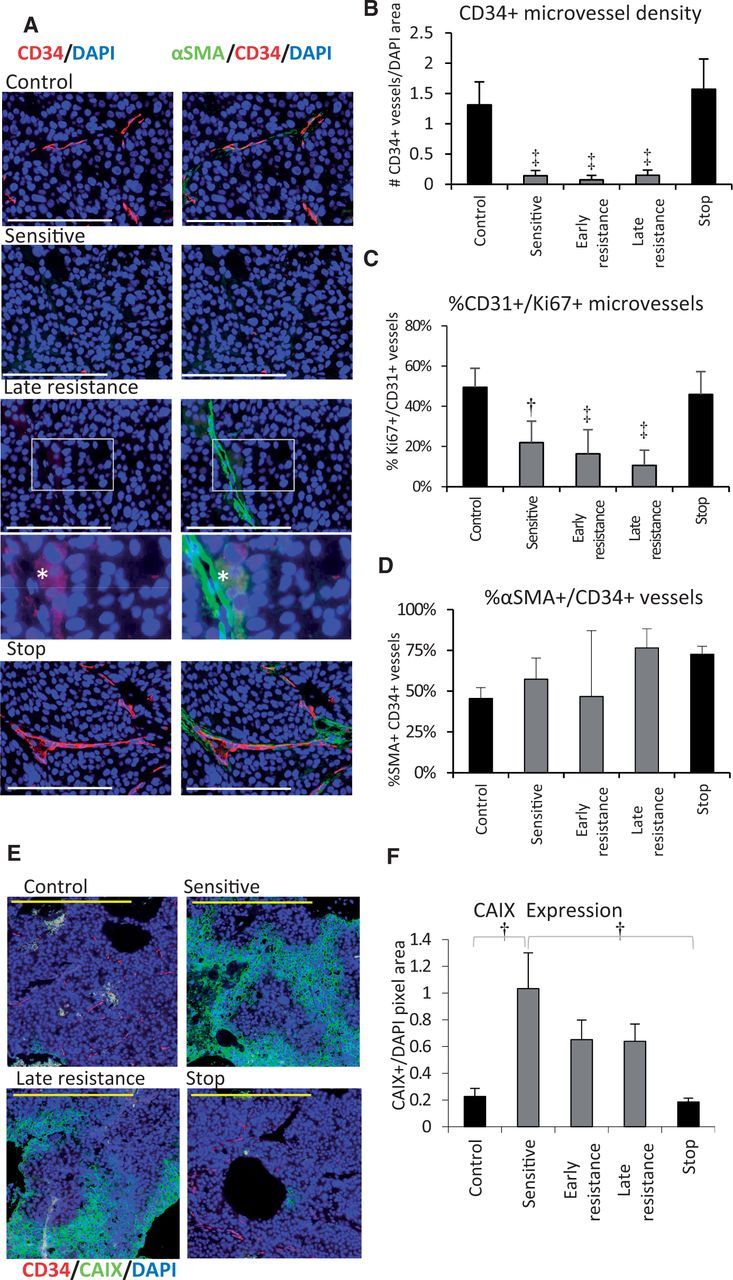
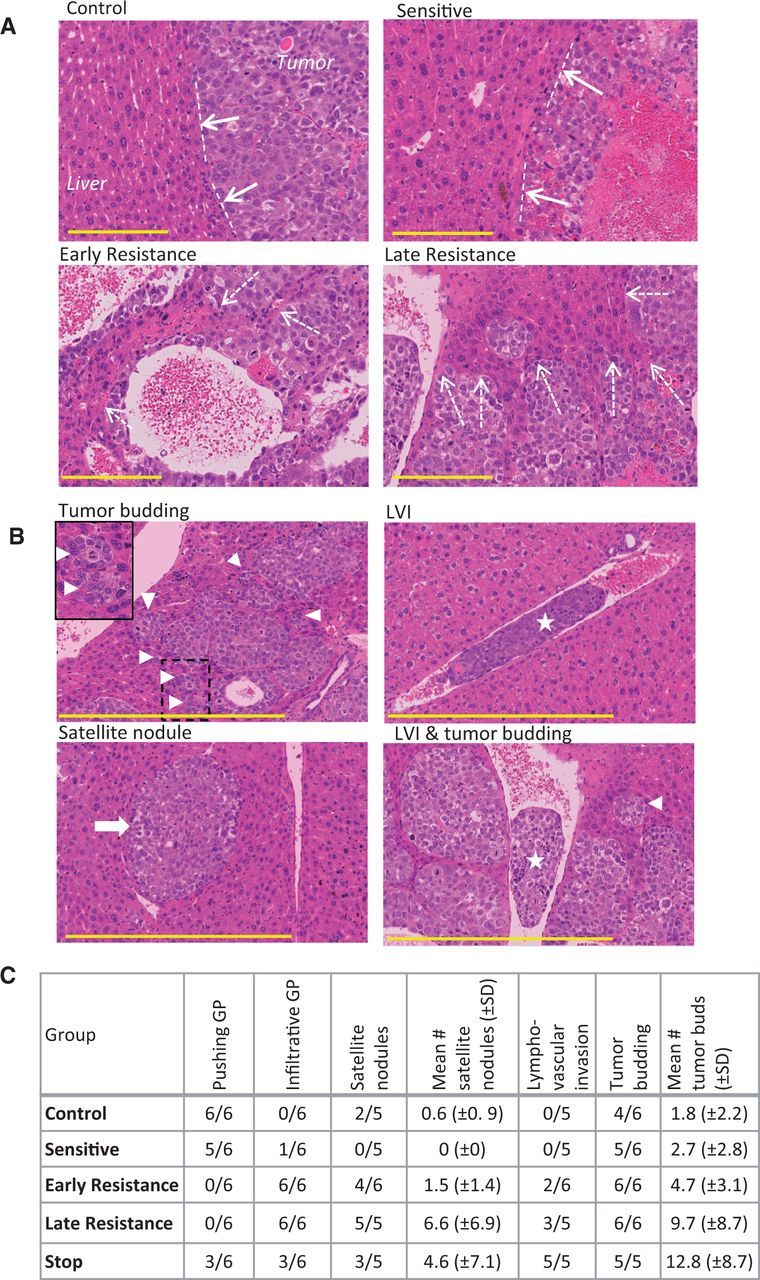
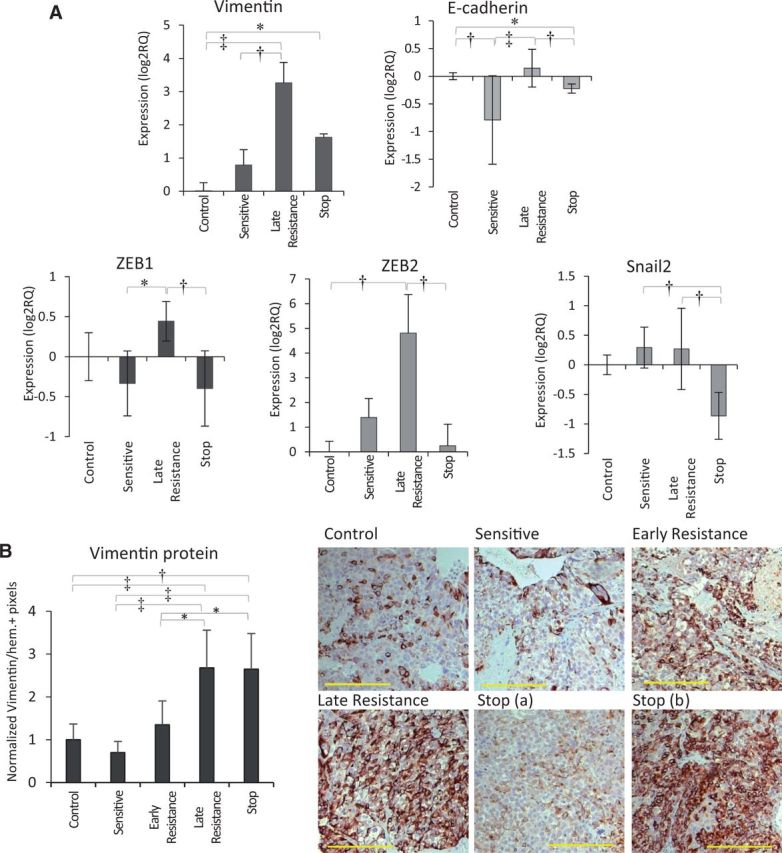
Results: While sorafenib initially inhibited angiogenesis and stabilized tumor growth, no angiogenic 'rebound' effect was observed during development of resistance unless therapy was stopped. Instead, resistant tumors became more locally infiltrative, which facilitated extensive incorporation of liver parenchyma and the co-option of liver-associated vessels. Up to 75% (±10.9%) of total vessels were provided by vessel co-option in resistant tumors relative to 23.3% (±10.3%) in untreated controls. miRNA sequencing implicated pro-invasive signaling and epithelial-to-mesenchymal-like transition during resistance development while functional imaging further supported a shift from angiogenesis to vessel co-option.

Conclusions: This is the first documentation of vessel co-option as a mechanism of acquired resistance to anti-angiogenic therapy and could have important implications including the potential therapeutic benefits of targeting vessel co-option in conjunction with vascular endothelial growth factor receptor signaling.


Figures

Figure 1.
Figure 1.
Characteristics of sorafenib-resistant orthotopic hepatocellular carcinoma (HCC) xenografts. A) Levels of βhCG (urinary hCG/creatinine) in orthotopic Hep3B-hCG tumor-bearing mice treated with vehicle or 30 mg/kg oral sorafenib are shown. The treatment interval is indicated. Mice were imaged (star) or sacrificed at the indicated time points to study sensitive and resistance disease. Therapy was stopped for two weeks in a subgroup of mice after the development of resistance to study resistance reversibility (“stop” group). n = 13 vehicle, 41 sorafenib (day -3). B) Hep3B-hCG tumors (square brackets) are shown in situ and excised with liver intact. Note that sorafenib-treated tumors are nonhemorrhagic and irregular. C) Representative low-magnification images of hematoxylin and eosin (H&E)–stained tumors are shown from each of the groups analyzed. An inset in the control tumor shows a highly hemorrhagic area (‘H’), which was characteristic of control and stop tumors. The percent of tumor necrosis statistically significantly increased over time during treatment unless therapy was discontinued (analysis of variance [ANOVA] P < .0001). L = liver; N = necrosis. D) Tumor cells regardless of treatment had a high proliferative index based on human Ki67 immunostaining (images at left), with a trend toward decreased cell proliferation during sorafenib sensitivity (ANOVA P = .01). Scale bars = 5 mm (yellow) and 100 µm (black). n = 6/group. *P < .05, †P < .01, ‡P < .001. Differences across experimental groups were evaluated by one-way ANOVA and Bonferroni’s multiple comparison test. Statistical tests were two-sided. Error bars represent standard deviation.
Figure 2.
Figure 2.
Tumor angiogenesis during sorafenib treatment. A) Immunofluorescent images of Hep3B-hCG angiogenic microvessel density by tumor staining for CD34+ microvessels (red), αSMA pericytes (green), and nuclei (DAPI; blue). CD34/DAPI merge are shown in the left column and CD34/αSMA/DAPI merge at right. During resistance, CD34-negative/αSMA+ vessel-like structures adjacent to autofluorescent cells became evident (*), shown magnified with enhanced contrast. B) CD34+ microvessel density normalized to DAPI statistically significantly decreased during treatment and rebounded after stopping therapy (analysis of variance [ANOVA] P < .001, ‡P < .001 vs control or stop groups). C) The proportion of tumor microvessels (CD31, green) containing proliferative endothelial cells (Ki67+) was also suppressed throughout treatment (ANOVA P < .001, †P < .01, and ‡P < .001 vs control or stop groups). Scale bars = 200 µm (white) and 100 µm (yellow). D) The proportion of %αSMA+ pericyte-covered CD34+ vessels was not statistically significantly associated with sorafenib sensitivity or with the early development of resistance (P > .05, ANOVA P = .002). E) Immunofluorescence staining for CAIX (green) as a hypoxia marker in hepatocellular carcinoma tumors. F) Quantification of CAIX expression by immunohistochemistry. Statistically significantly upregulated CAIX levels occurred during treatment (ANOVA P = .002). n = 6/group. *P < .05, †P < .01. Data were analyzed by one-way ANOVA and Bonferroni’s multiple comparison test. Error bars represent standard deviation.
Figure 3.
Figure 3.
Global analysis of hepatocellular carcinoma (HCC) tumor perfusion during sorafenib treatment using contrast-enhanced ultrasound imaging. Representative parametric maps of peak enhancement (PE), an indicator of tissue blood volume, show changes in tumor perfusion in a (A) vehicle-treated and (B) sorafenib-treated mouse. Red represents regions of high PE, blue are areas of low PE, and black represents no perfusion. C) Average PE values decreased statistically significantly two weeks after sorafenib therapy (P < .001, †P < .001 vs pretreatment), but further changes were not statistically significant for the following weeks. No statistically significant changes occurred in vehicle-treated mice (P = .07) whereas a statistically significant change was observed between vehicle- and sorafenib-treated mice by week 2 (*P < .05). Vehicle control mice were sacrificed after week 2. D) Wash-in rate, used as an indicator of rate of blood flow, showed no statistically significant changes over time, including during periods of drug resistance. Statistically significant changes were only observed between pre- and post-treatment for both sorafenib (P < .001, †P < .001)- and vehicle (paired t test *P < .05)-treated groups. n = 4 (vehicle), n = 11 (sorafenib). Global perfusion changes were tested by repeated measures one-way analysis of variance. Error bars represent standard deviation.
Figure 4.
Figure 4.
Histopathological signs of invasion in hepatocellular carcinoma (HCC) xenografts. A) Tumor growth patterns were predominantly pushing in control and sensitive tumors (dashed lines and solid arrows) and were mostly infiltrative growth (resistance phases), leading to tumor incorporation of liver parenchyma (dashed arrows). Tumors were stained with hematoxylin and eosin. B) Tumor budding (triangle; box demonstrates magnified area), lymphovascular invasion (LVI; star), and satellite nodules (arrow), additional signs of tumor aggressiveness, were common in resistant tumors. C) The prevalence of some of the invasive tumor features tended to increase from control and sensitive to resistant tumors, with a mixed phenotype in stop group tumors. (n = 6 per group). Scale bar = 200 µm. GP = growth pattern.
Figure 5.
Figure 5.
Evidence of liver vessel co-option in hepatocellular carcinoma (HCC) xenografts. A) Tumor sections were stained for human lamin-A/C (brown), hematoxylin and eosin, and CD31 (blue) to differentiate between co-opted liver parenchyma- and tumor-derived vessels. B. Non-co-opted vessels, the tumor-embedded vessels (TVs), and connective tissue vessels (CTVs) are surrounded by tumor cells or fibroblasts, respectively. C) Hepatocyte-embedded vessels (HVs) were the most common microvessel structures found in sorafenib-treated Hep3B-hCG tumors, varying from single-layered hepatocytes (left) to large patches of hepatocytes associated with CD31+ vessels (right). Inset shows magnified HVs. D) Central veins (CVs), shown in the liver (left), were also observed in the tumor. E) The vessels of portal triads (PTs) were also observed in the liver (left) as well as in the tumor. F) TVs were characteristic of control tumors, and they diminished during sorafenib treatment (analysis of variance [ANOVA] P < .001, ‡P < .001 vs control and stop groups), after which HVs predominated (ANOVA P = .53). After initial depletion by sorafenib treatment, CTVs tended to re-emerge over time, particularly after stopping therapy (ANOVA P < .001). Examples shown are from control (B, left), stop (B, right), and early or late resistant tumors (C-E). G) Tumor-incorporated PTs and CVs tended to increase in prevalence during treatment (ANOVA P = .14 and P = .08, respectively). H) The % co-opted (HV+CV+PT) out of total vessels statistically significantly increased during sorafenib treatment (ANOVA P < .001). bd = bile duct. Scale bar = 300 µm; n = 5-6/group. Triangle = vessel type indicated. †P < .01, ‡P < .001. Data were analyzed by one-way ANOVA and Bonferroni’s multiple comparison test. Error bars represent standard deviation.
Figure 6.
Figure 6.
Pro-invasive and EMT-like signaling in tumor cells during sorafenib resistance. A) Analysis of EMT-associated genes indicated statistically significant upregulation of vimentin (H = 26.85, P < .001) and ZEB2 (H = 15.69, P = .001) mRNA during sorafenib resistance. Statistically significant changes in E-cadherin (H = 23.49, P < .001) and Snail2 (H = 16.12, P = .001) were also observed including reduction of E-cadherin between control and sensitive groups (P < .01). n = 3/group. Data were analyzed by Kruskal-Wallis followed by Dunn’s multiple comparison test. B) Vimentin protein expression by immunohistochemical analysis was statistically significantly upregulated from sensitive to late resistance phases (P < .01), with a mixed phenotype in stop tumors (analysis of variance [ANOVA] P < .001; scale bar = 200 µm). n = 6 per group. Vimentin protein expression was analyzed by one-way ANOVA and Bonferroni’s multiple comparison test. *P < .05, †P < .01, ‡P < .001. All statistical tests were two-sided. Error bars represent standard deviation.
Figure 7.
Figure 7.
Local perfusion analysis of sorafenib-treated hepatocellular carcinoma (HCC) tumors. A) Representative peak enhancement (PE, representing blood volume) maps of a vehicle control-treated mouse pretreatment and after two weeks. B) PE maps of a sorafenib-treated mouse weeks 2-10. Resistance typically occurs weeks 5-6. C) Examples of contrast-enhanced ultrasound images (top) and corresponding histological sections and features of HCC tumors stained for CD31 (blue), human lamin A/C (brown), and hematoxylin and eosin. The expanded regions (boxes) demonstrate that high tumor-embedded vessel (TV, black arrows) or hepatocyte vessel (HV, white triangles) densities correspond to high-contrast regions in control vs sorafenib-resistant tumors, respectively (scale bar = 2 mm). Large vessels evident in sonograms resemble the large liver vessels within the tumor, such as central veins (CVs), shown here. * = necrotic region. D) Histograms of the local PE values in control and sorafenib-treated tumors are shown pretreatment and after two weeks of therapy. Following treatment, the frequency of the PE measurements in the lowest interval increased while the values in 27 of the other 29 PE intervals reduced statistically significantly (P < .05). Changes in the PE value distribution of the control group were not statistically significant (P > .05). PE distribution in the normal liver is indicated by the dashed lines. E) Similar distributions of PE values were observed between weeks 2, 5, 7 and 10 on sorafenib therapy. The mean values ± standard deviations are presented for every interval of PE values. n = 4 (vehicle), n = 11 (sorafenib). PE frequencies were tested using two-sided two-sample t tests.

Comment in

References

    1. Llovet JM, Ricci S, Mazzaferro V, et al. Sorafenib in advanced hepatocellular carcinoma. N Engl J Med. 2008;359(4):378–390. - PubMed
    1. Cheng AL, Kang YK, Chen Z, et al. Efficacy and safety of sorafenib in patients in the Asia-Pacific region with advanced hepatocellular carcinoma: a phase III randomised, double-blind, placebo-controlled trial. Lancet Oncol. 2009;10(1):25–34. - PubMed
    1. Wilhelm SM, Adnane L, Newell P, Villanueva A, Llovet JM, Lynch M. Preclinical overview of sorafenib, a multikinase inhibitor that targets both Raf and VEGF and PDGF receptor tyrosine kinase signaling. Mol Cancer Ther. 2008;7(10):3129–3140. - PMC - PubMed
    1. Sennino B, McDonald DM. Controlling escape from angiogenesis inhibitors. Nat Rev Cancer. 2012;12(10):699–709. - PMC - PubMed
    1. Vasudev N, Reynolds A. Anti-angiogenic therapy for cancer: current progress, unresolved questions and future directions. Angiogenesis. 2014;17(3):471–494. - PMC - PubMed

MeSH terms

Substances

Grants and funding