. 2016 Jul;132(1):59-75.
doi: 10.1007/s00401-016-1572-y. Epub 2016 Apr 8.

α-Synuclein-induced myelination deficit defines a novel interventional target for multiple system atrophy

Affiliations

α-Synuclein-induced myelination deficit defines a novel interventional target for multiple system atrophy

Benjamin Ettle et al. Acta Neuropathol. 2016 Jul.

Abstract

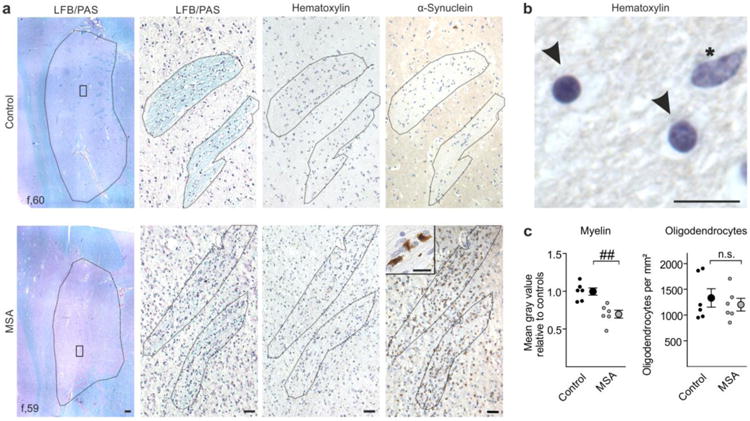
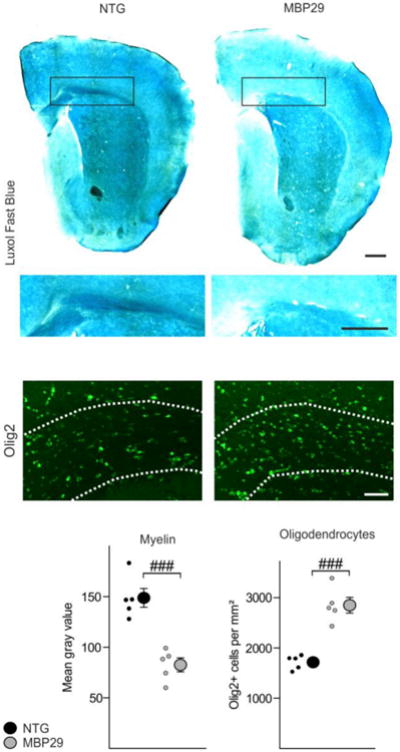
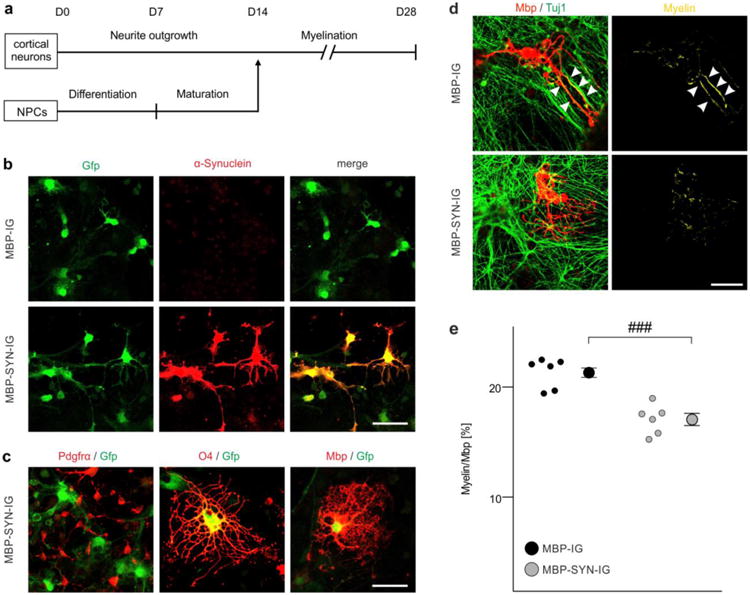
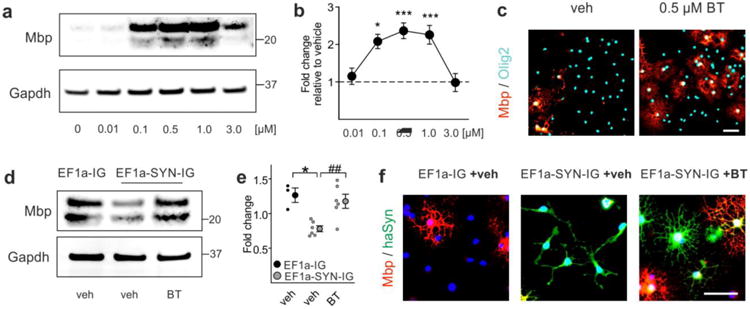
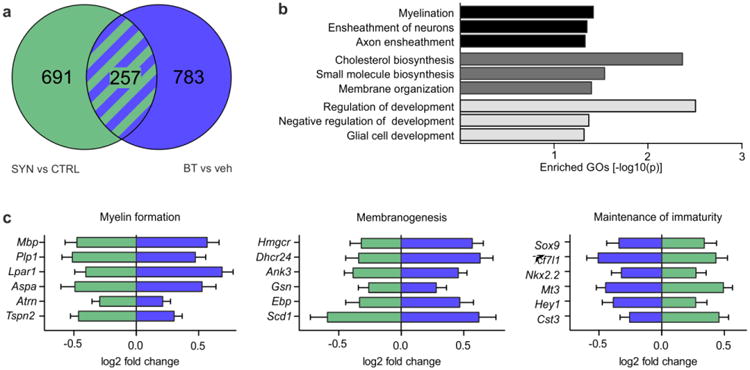
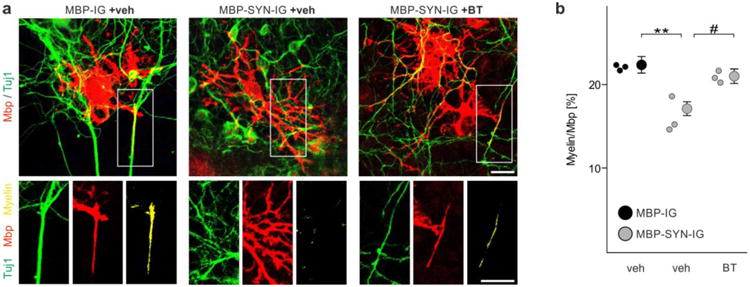
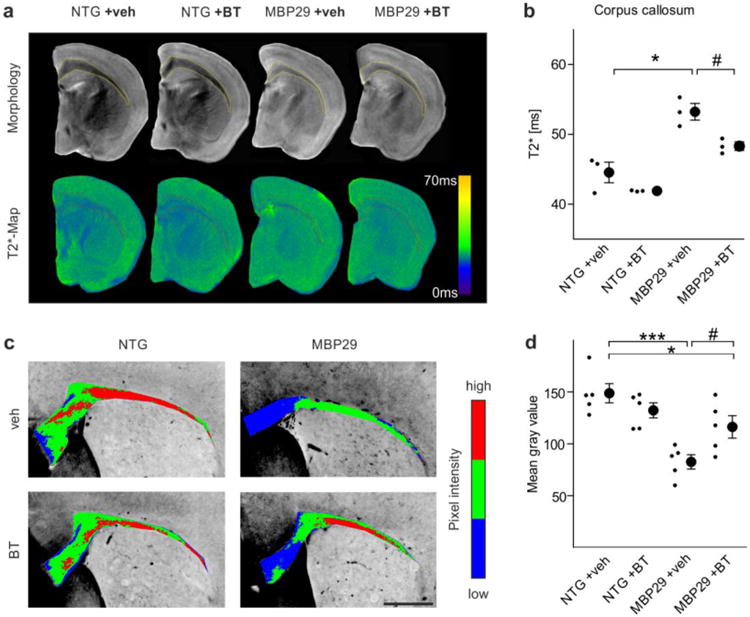
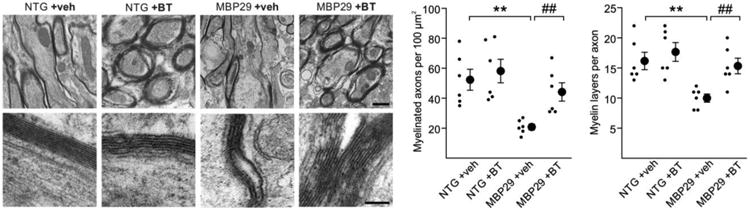
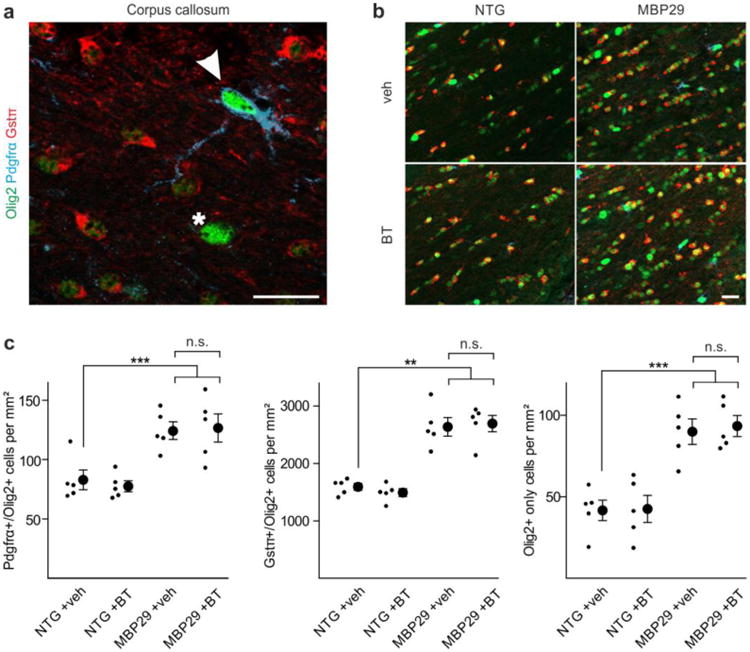
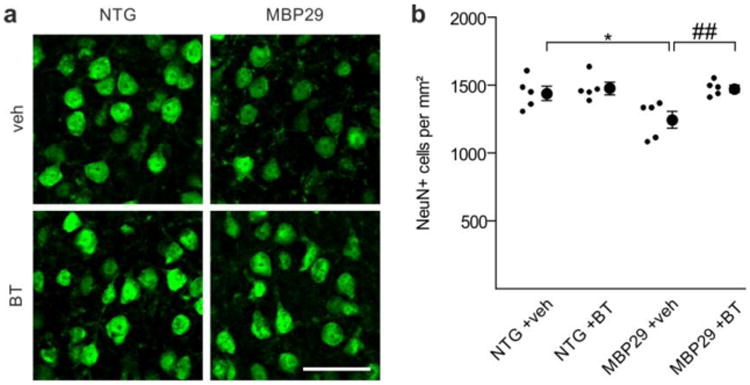
Multiple system atrophy (MSA) is a rare atypical parkinsonian disorder characterized by a rapidly progressing clinical course and at present without any efficient therapy. Neuropathologically, myelin loss and neurodegeneration are associated with α-synuclein accumulation in oligodendrocytes, but underlying pathomechanisms are poorly understood. Here, we analyzed the impact of oligodendrocytic α-synuclein on the formation of myelin sheaths to define a potential interventional target for MSA. Post-mortem analyses of MSA patients and controls were performed to quantify myelin and oligodendrocyte numbers. As pre-clinical models, we used transgenic MSA mice, a myelinating stem cell-derived oligodendrocyte-neuron co-culture, and primary oligodendrocytes to determine functional consequences of oligodendrocytic α-synuclein overexpression on myelination. We detected myelin loss accompanied by preserved or even increased numbers of oligodendrocytes in post-mortem MSA brains or transgenic mouse forebrains, respectively, indicating an oligodendrocytic dysfunction in myelin formation. Corroborating this observation, overexpression of α-synuclein in primary and stem cell-derived oligodendrocytes severely impaired myelin formation, defining a novel α-synuclein-linked pathomechanism in MSA. We used the pro-myelinating activity of the muscarinic acetylcholine receptor antagonist benztropine to analyze the reversibility of the myelination deficit. Transcriptome profiling of primary pre-myelinating oligodendrocytes demonstrated that benztropine readjusts myelination-related processes such as cholesterol and membrane biogenesis, being compromised by oligodendrocytic α-synuclein. Additionally, benztropine restored the α-synuclein-induced myelination deficit of stem cell-derived oligodendrocytes. Strikingly, benztropine also ameliorated the myelin deficit in transgenic MSA mice, resulting in a prevention of neuronal cell loss. In conclusion, this study defines the α-synuclein-induced myelination deficit as a novel and crucial pathomechanism in MSA. Importantly, the reversible nature of this oligodendrocytic dysfunction opens a novel avenue for an intervention in MSA.

Keywords: Multiple system atrophy; Myelin; Oligodendrocyte progenitor cells; Oligodendrocytes; α-Synuclein.


Conflict of interest statement

Conflicts of interest: The authors declare that they have no conflict of interest.

Figures

Fig. 1
Fig. 1
Putaminal myelin loss in multiple system atrophy (MSA) without alterations in oligodendrocyte density. a Representative Luxol Fast Blue/Periodic Acid Schiff (LFB/PAS) stained images (left) depict the putamen (encircled) of a control (upper panel) and a MSA patient (lower panel). The putamen of the MSA patient showed a reduced Luxol Fast Blue staining intensity reflecting severe loss of myelin. Scale bar: 500μm. Boxed areas within the left images are magnified showing LFB/PAS-, hematoxylin-, and α-synuclein-stained striae. Note abundant α-synuclein-positive inclusions in the putamen of the MSA patient (magnified as insert). Scale bars: 50μm, insert 10μm. b Oligodendrocytes (arrowheads; round-shaped, dense chromatin) were distinguished by morphology from astrocytes (asterisk; larger and more elongated in size, loose chromatin) in the hematoxylin stained-sections. Scale bar: 10μm. c While myelin was significantly reduced in MSA patients (gray dots) compared to controls (black dots), oligodendrocyte density was unaltered (n = 6). Data are shown as mean ± standard error of mean. T-test: ##p < 0.01, n.s. (not significant) p > 0.05. f = female.
Fig. 2
Fig. 2
Severe myelin deficit despite increased oligodendrocyte density in mice overexpressing human α-synuclein under a myelin basic protein-promoter (MBP29). MBP29 mice (3 months of age) showed a profound myelin deficit (illustrated by gray scale images of a Luxol Fast Blue staining and quantified within the corpus callosum; scale bars: 500μm). Density of callosal oligodendrocytes (identified by Olig2; scale bar: 50μm) was increased by 1.7 fold. Data are shown as mean ± standard error of mean. T-test (n = 5): ###p < 0.001. NTG = non-transgenic mice.
Fig. 3
Fig. 3
Impaired myelination of α-synuclein-overexpressing mouse embryonic stem cell-derived oligodendrocytes. a The experimental paradigm to analyze myelination of individual oligodendrocytes in the mouse embryonic stem cell-derived oligodendrocyte-neuron co-culture is schematically illustrated according to [25]. b Stem cell-derived oligodendrocytes expressed human α-synuclein (when transduced with MBP-SYN-IG expression vector only; lower panel) and green fluorescent protein (Gfp) (also when transduced with the MBP-IG control vector; upper panel). Expression of α-synuclein overlapped with GFP expression in MBP-SYN-IG transduced oligodendrocytes. Scale bar: 20μm. c Co-labeling with stage-specific oligodendrocytic markers revealed the specificity of myelin basic protein (Mbp) promoter-driven transgene expression for mature oligodendrocytes (positive for the early maturation marker O4 and Mbp as a marker for terminal maturation), whereas transgene expression was not detectable in platelet-derived growth factor receptor-α (Pdgfrα)-positive oligodendrocyte progenitor cells. Scale bar: 20μm. d Representative images of control (transduced with MBP-IG prior to starting the co-culture) and α-synuclein-overexpressing (transduced with MBP-SYN-IG) Mbp-positive oligodendrocytes co-cultured with beta-III-tubulin (Tuj1)-positive cortical neurons are depicted. Myelination (yellow; arrowheads) was regularly detected under control condition, whereas α-synuclein overexpression impaired myelin formation. Scale bar: 20μm. e Myelination of individual oligodendrocytes (altogether: MBP-IG: 235 cells, MBP-SYN-IG: 215 cells) in the stem cell-derived co-culture was quantified (n = 6) by calculating the ratio of Mbp/Tuj1-positive pixels over total Mbp-positive pixels and is shown as percentage. α-Synuclein-overexpressing oligodendrocytes (gray dots) formed significantly less myelin than controls (black dots). Data are shown as mean ± standard error of mean. T-test: ###p < 0.001.
Fig. 4
Fig. 4
Benztropine restores myelin basic protein (Mbp) expression in α-synuclein-overexpressing primary oligodendrocyte progenitor cells (OPCs). a The dose-dependent effect of benztropine on Mbp expression in primary OPCs is illustrated using Western blot. Gapdh signal served as control. b Benztropine significantly increased Mbp gene expression in a range of 0.1-1.0 μM as quantified by real time PCR (n = 3-6). c Immunocytochemistry for Mbp and Olig2 illustrates the effect of 0.5 μM benztropine (BT) on OPC maturation in comparison to vehicle- (veh) treated cells. Scale bar: 20μm. d The restoration of Mbp expression in α-synuclein-overexpressing cells (EF1a-SYN-IG +veh) upon treatment with 0.5 μM benztropine (EF1a-SYN-IG +BT) to control levels (EF1a-IG +veh) is demonstrated by Western blot. Gapdh signal served as control. e Benztropine restored Mbp gene expression in α-synuclein-overexpressing OPCs as quantified by real time PCR (n = 3-6). f α-Synuclein-overexpressing cells exhibited the typical morphology of OPCs (bi-/tripolarity), whereas treatment with benztropine induced Mbp expression and formation of multiple processes as signs of advanced maturity comparable to control condition. Scale bar: 20μm. Data are shown as mean ± standard error of mean. ANOVA: *p < 0.05, ***p < 0.001. T-test: ##p < 0.01.
Fig. 5
Fig. 5
Restored myelinogenic capacity of α-synuclein-overexpressing primary rat oligodendrocyte progenitor cells (OPCs) by benztropine. a A Venn diagram depicts differentially regulated genes revealed by RNA sequencing of primary rat OPCs (n = 3). Green circle: α-synuclein-overexpressing (SYN) versus control cells (CTRL). Blue circle: benztropine (BT) versus vehicle (veh)-treated α-synuclein-overexpressing cells. b Genes differentially regulated by both α-synuclein overexpression and benztropine treatment classified into gene ontologies (GOs) implicated among others in myelin formation (black), membranogenesis (dark gray), and maintenance of oligodendrocyte immaturity (light gray). c Expression dynamics of representative genes identified by GO term enrichment are listed. Benztropine (blue) oppositely regulated genes differentially expressed upon α-synuclein overexpression (green). Myelin formation: Mbp = myelin basic protein, Plp1 = proteolipid protein 1, Lpar1 = lysophosphatidic acid receptor 1, Aspa = aspartoacylase, Atrn = attractin, Tspn2 = tetraspanin 2; Membranogenesis: Hmgcr = 3-hydroxy-3-methylglutaryl-CoA reductase, Dhcr24 = 24-dehydrocholesterol reductase, Ank3 = ankyrin 3, Gsn = gelsolin, Ebp = emopamil binding protein (sterol isomerase), Scd1 = stearoyl-CoA desaturase-1; Maintenance of immaturity: Sox9 = sex determining region Y-box 9, Tcf7l1 = transcription factor 7-like 1, Nkx2.2 = Nk2 homeobox 2, Mt3 = metallothionein 3, Hey1 = hes-related family bHLH transcription factor with YRPW motif 1, Cst3 = cystatin C.
Fig. 6
Fig. 6
Restored myelination deficit of α-synuclein-overexpressing mouse embryonic stem cell-derived oligodendrocytes by benztropine. a Representative images show that overexpression of α-synuclein (transduced with MBP-SYN-IG prior to starting the co-culture) impaired myelin formation of stem cell-derived oligodendrocytes (stained for myelin basic protein, Mbp) co-cultured with cortical neurons (beta-III-tubulin, Tuj1). Addition of benztropine enhanced myelin formation of α-synuclein-overexpressing cells (comparable to vehicle (veh)-treated control cells, which were transduced with MBP-IG). Mbp-positive pixels co-localizing with Tuj1-positive pixels were considered as myelin (shown in yellow). Scale bar: 20μm. b Myelination of individual oligodendrocytes (in total 90-110 cells per condition) was quantified (n = 3). α-Synuclein-overexpressing oligodendrocytes (gray dots) in the presence of vehicle (veh) formed significantly less myelin than controls (black dots, veh). Benztropine (BT) restored the myelination deficit of α-synuclein overexpressing oligodendrocytes. Data are shown as mean ± standard error of mean. ANOVA: ***p < 0.001. T-test: ##p < 0.01.
Fig. 7
Fig. 7
Amelioration of the myelin deficit in mice with oligodendrocytic overexpression of α-synuclein (MBP29) upon benztropine treatment. a Callosal myelin levels of non-transgenic (NTG) and MBP29 mice treated with vehicle (veh) or benztropine (BT, 2mg/kg) were analyzed using magnetic resonance imaging. Upper panel illustrates morphology as determined by T2-weighted magnetic resonance imaging, whereas lower panel depicts T2*-weighted magnetic resonance imaging (shown as color-coded maps), which was used for myelin quantification. b MBP29 mice (n = 3) showed a reduction in myelin levels detected by increased T2*-relaxation times within the corpus callosum. Benztropine attenuated the myelin deficit in MBP29 confirmed by a reduction of T2*. c Representative pictures of a Luxol Fast Blue staining (color-coded for signal intensity: blue low, green intermediate, red high intensity), confirming the effects of α-synuclein overexpression and benztropine treatment on myelination. Scale bar: 500μm. d MBP29 mice (n = 5) exhibited a reduction in Luxol Fast Blue intensity, which was attenuated, but not completely restored by benztropine. Data are shown as mean ± standard error of mean. ANOVA: *p < 0.05, ***p < 0.001. T-test: #p < 0.05.
Fig. 8
Fig. 8
Structural restoration of myelin by benztropine in mice overexpressing α-synuclein in oligodendrocytes (MBP29). Representative electron micrographs of the corpus callosum at low (upper panel, scale bar: 1μm) and high (lower panel, scale bar: 0.2μm) magnification depict myelin sheaths of non-transgenic (NTG) and MBP29 mice treated with either vehicle (veh) or benztropine (BT). In vehicle-treated MBP29 mice only, myelin appeared strongly reduced and disorganized. Quantification of myelinated axons and myelin layers per axon revealed a significant myelin deficit in vehicle-treated MBP29 mice, which was restored by benztropine treatment to control level. Data are shown as mean ± standard error of mean. ANOVA (n = 6): **p < 0.01. T-test: ##p < 0.01.
Fig. 9
Fig. 9
No alteration of oligodendrocyte density by benztropine. a Oligodendrocytic cells within the corpus callosum were identified using stage specific markers (entire population: Olig2; oligodendrocyte progenitor cells: platelet-derived growth factor receptor-α (Pdgfrα)/Olig2strong (arrowhead), mature oligodendrocytes: glutathione-s-transferase-π (Gstπ)/Olig2weak, as well as cells staining for Olig2strong only (asterisk)). Scale bar: 20μm. b A profound increase of oligodendrocytic cells within the corpus callosum of mice overexpressing α-synuclein in oligodendrocytes (MBP29) compared to non-transgenic controls (NTG) was observed. Scale bar: 20μm. c While MBP29 mice exhibited an almost 2-fold increased density of the entire spectrum of oligodendrocytic subpopulations, benztropine (BT) had no effect on oligodendrocytic cell density as compared to vehicle (veh)-treatment. Data are shown as mean ± standard error of mean. ANOVA (n = 5): **p < 0.01, ***p < 0.001. T-test: not significant (n.s.) p > 0.05.
Fig. 10
Fig. 10
Prevention of motor cortical neuronal cell loss in mice overexpressing α-synuclein in oligodendrocytes by benztropine. a Representative images depict NeuN-positive neuronal cells within the motor cortex of non-transgenic controls (NTG) and α-synuclein transgenic mice (MBP29) treated with vehicle (veh) or benztropine (BT). Scale bar: 20μm. b Densities of motor cortical neurons are shown (n = 5). In vehicle-treated MBP29 mice, a significant reduction in neuronal cell density was observed. Benztropine treatment prevented the loss of cortical neurons in MBP29 mice. Data are shown as mean ± standard error of mean. ANOVA: *p < 0.05. T-test: ##p < 0.01.

Similar articles

Cited by

References

    1. Ahmed Z, Asi YT, Sailer A, Lees AJ, Houlden H, Revesz T, Holton JL. The neuropathology, pathophysiology and genetics of multiple system atrophy. Neuropathol Appl Neurobiol. 2012;38:4–24. doi: 10.1111/j.1365-2990.2011.01234.x. - DOI - PubMed
    1. Ahmed Z, Asi YT, Lees AJ, Revesz T, Holton JL. Identification and quantification of oligodendrocyte precursor cells in multiple system atrophy, progressive supranuclear palsy and Parkinson's disease. Brain Pathol. 2013;23:263–73. doi: 10.1111/j.1750-3639.2012.00637.x. - DOI - PMC - PubMed
    1. Anders S, Pyl PT, Huber W. HTSeq--a Python framework to work with high-throughput sequencing data. Bioinformatics. 2015;31:166–9. doi: 10.1093/bioinformatics/btu638. - DOI - PMC - PubMed
    1. Asi YT, Simpson JE, Heath PR, Wharton SB, Lees AJ, Revesz T, Houlden H, Holton JL. Alpha-synuclein mRNA expression in oligodendrocytes in MSA. Glia. 2014;62:964–70. doi: 10.1002/glia.22653. - DOI - PMC - PubMed
    1. Bleasel JM, Hsiao JH, Halliday GM, Kim WS. Increased expression of ABCA8 in multiple system atrophy brain is associated with changes in pathogenic proteins. J Parkinsons Dis. 2013;3:331–9. doi: 10.3233/JPD-130203. - DOI - PubMed

Publication types

MeSH terms