. 2016 May 5;44(8):3750-62.
doi: 10.1093/nar/gkw219. Epub 2016 Apr 7.

Polymorphic tandem repeats within gene promoters act as modifiers of gene expression and DNA methylation in humans

Affiliations

Polymorphic tandem repeats within gene promoters act as modifiers of gene expression and DNA methylation in humans

Javier Quilez et al. Nucleic Acids Res. .

Abstract

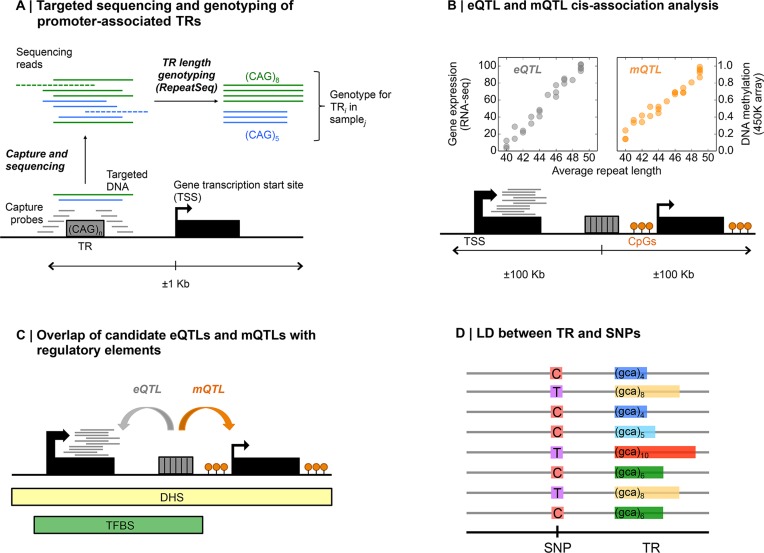
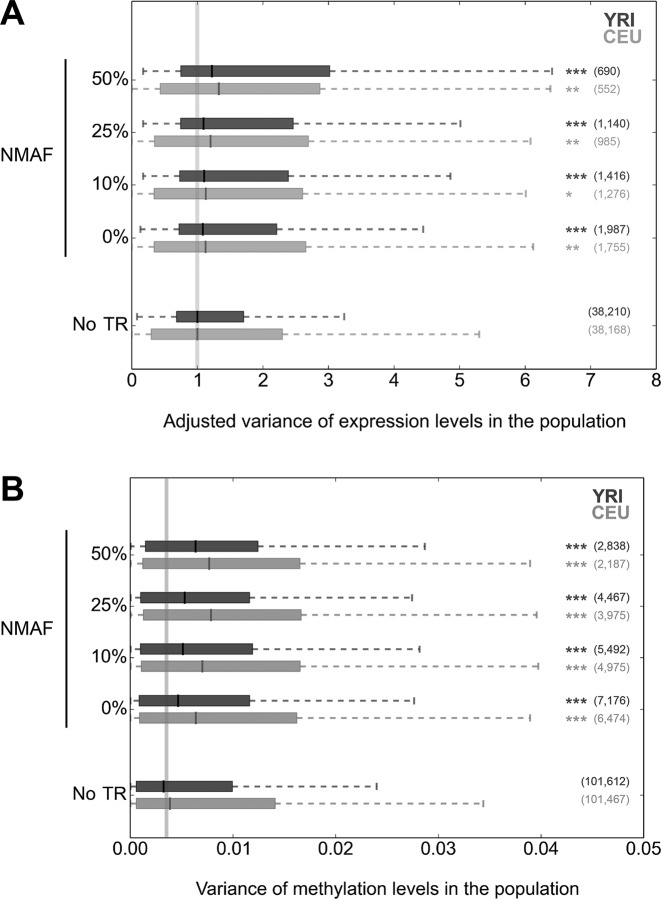
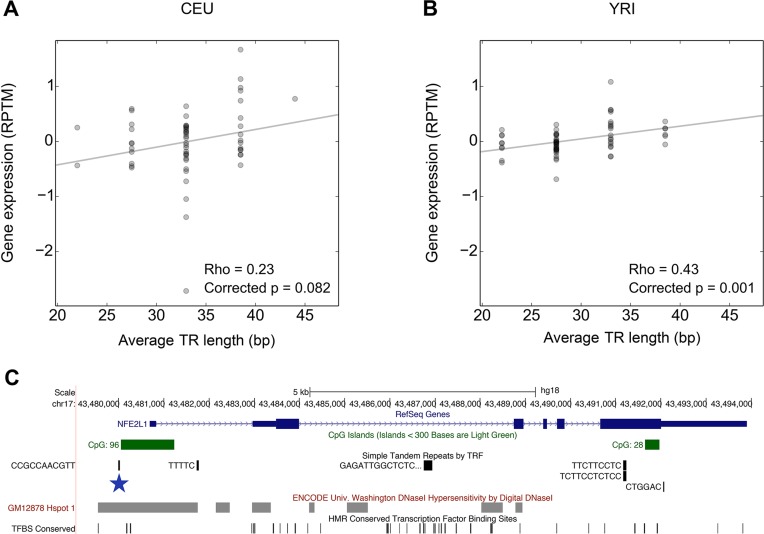
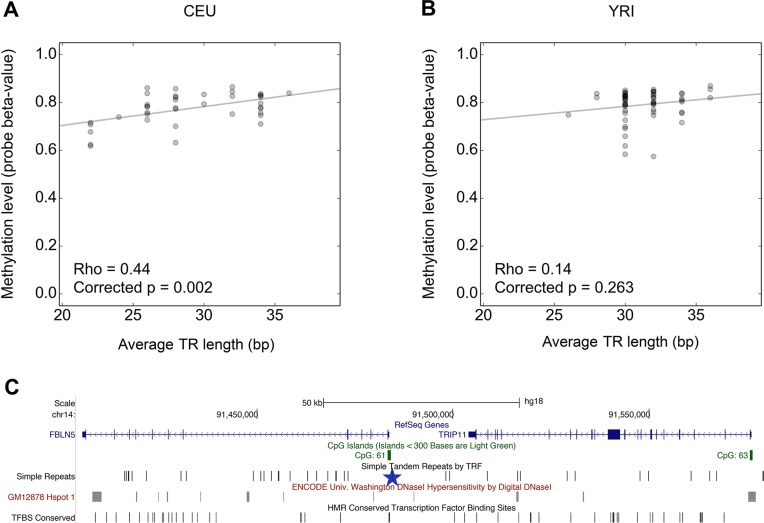
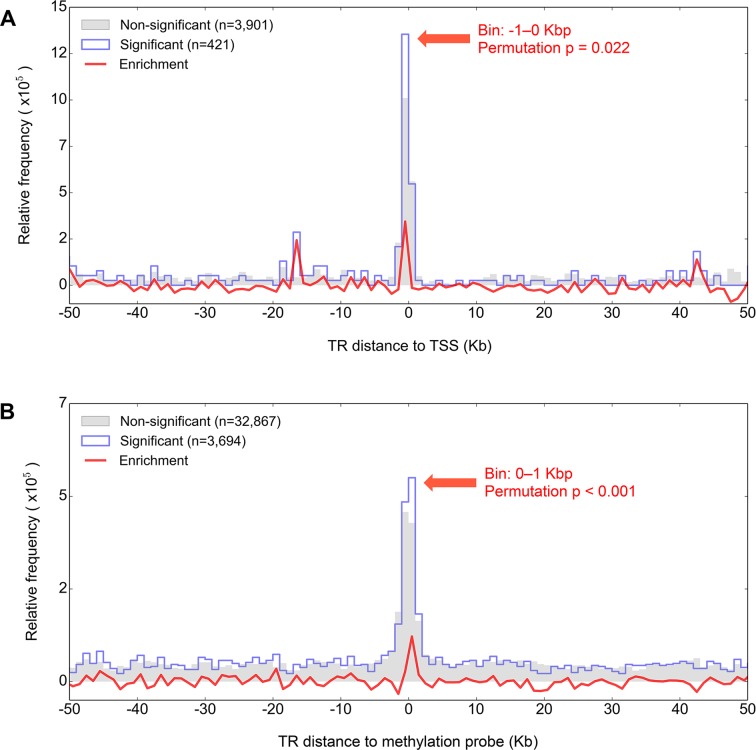
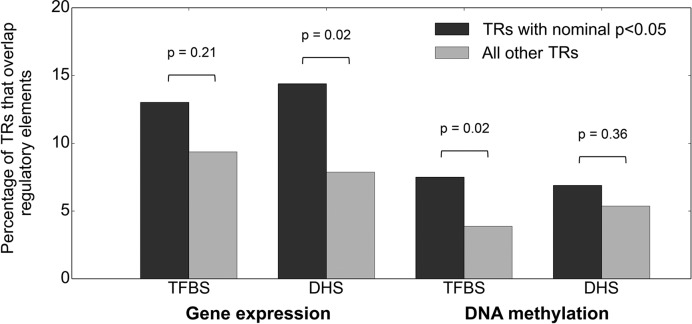
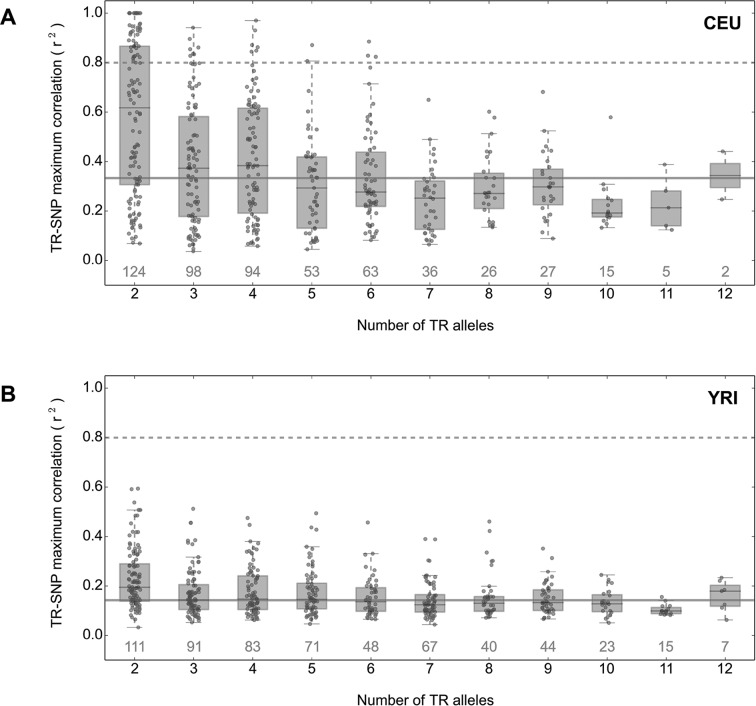
Despite representing an important source of genetic variation, tandem repeats (TRs) remain poorly studied due to technical difficulties. We hypothesized that TRs can operate as expression (eQTLs) and methylation (mQTLs) quantitative trait loci. To test this we analyzed the effect of variation at 4849 promoter-associated TRs, genotyped in 120 individuals, on neighboring gene expression and DNA methylation. Polymorphic promoter TRs were associated with increased variance in local gene expression and DNA methylation, suggesting functional consequences related to TR variation. We identified >100 TRs associated with expression/methylation levels of adjacent genes. These potential eQTL/mQTL TRs were enriched for overlaps with transcription factor binding and DNaseI hypersensitivity sites, providing a rationale for their effects. Moreover, we showed that most TR variants are poorly tagged by nearby single nucleotide polymorphisms (SNPs) markers, indicating that many functional TR variants are not effectively assayed by SNP-based approaches. Our study assigns biological significance to TR variations in the human genome, and suggests that a significant fraction of TR variations exert functional effects via alterations of local gene expression or epigenetics. We conclude that targeted studies that focus on genotyping TR variants are required to fully ascertain functional variation in the genome.


Figures

Figure 1.
Figure 1.
Scheme of the TR genotyping strategy and downstream analyses. (A) Illustration of the TR targeted sequencing approach. Oligonucleotide probes are designed to hybridize and capture the genomic DNA of a promoter-associated repeat. After sequencing, only reads which span the entire repeat and have sufficient anchoring sequence at both flanks are informative and considered for genotyping, while other reads are discarded. TR length genotyping is performed using RepeatSeq (21). (B) For TR:gene and TR:CpG pairs separated by <100 kb we calculated Rho values between mean TR genotypes and (i) transcript expression levels derived from normalized RNA-sequencing (RNA-seq) data, (ii) CpG methylation levels derived from normalized microarray data. (C) To assess their functional impact, TRs were overlapped with functional elements such as transcription factor binding sites (TFBS) and DNaseI hypersensitivity sites (DHS). (D) In order to assess how effectively SNP arrays can tag TRs, we assessed levels of LD between TRs and flanking SNPs.
Figure 2.
Figure 2.
Increased expression and methylation variation associated with polymorphic TRs. Distributions of variance in local (A) gene expression and (B) DNA methylation levels for CEU (light gray) and YRI (dark gray) samples based on increasing rates of TR polymorphism. NMAF refers to the non-modal allele frequency, the aggregated frequencies of all alleles other than the most common. To the right of each plot the number of genes in each category is indicated in parentheses, while asterisks indicate a significant difference of the median from the null distribution, as inferred through permutation analysis (*P < 0.05; **P < 0.01; ***P < 0.001). In the top panel (variance of gene expression), to allow for meaningful comparison in a single plot we normalized the ranges of values in CEU and YRI by dividing each by the median value of genes with no promoter-associated TR. In each figure the vertical gray line indicates the median value for the ‘No TR’ category. TR:gene and TR:CpG pairs were based on a separation of ≤1 kb.
Figure 3.
Figure 3.
Identification of a TR eQTL associated with expression of NFE2L1. In (A) CEU and (B) YRI populations, scatter plots of TR length genotypes against gene expression values inferred from RNA-seq for the ENST00000361665 transcript of the NFE2L1 gene [GeneBank Gene ID: 4779]; RPTM correspond to reads per transcript per million of reads after PEER normalization (see ‘Materials and Methods’ section). Shown are the Rho values with P-values corrected for multiple testing through permutations and the best linear fit of the data (trend line). (C) The CCGCCAACGTT repeat (chr17:43,479,993–43,480,025, hg19) (blue star) is located upstream of the NFE2L1 gene [GeneBank Gene ID: 4779] and overlaps a predicted DHS.
Figure 4.
Figure 4.
Identification of an TR mQTL affecting methylation at TRIP11. Scatter plots of population values of TR length against methylation values of probe cg14294158 in (A) CEU and (B) YRI individuals. Shown are correlation Rho values with P-values corrected for multiple testing through permutation, and the best linear fit of the data. (C) Location of the TGTT-repeat (blue star) at chr14:91,484,391–91,484,491, downstream of the TRIP11 gene [GeneBank Gene ID: 9321].
Figure 5.
Figure 5.
TRs that are significant eQTLs and mQTLs preferentially co-localize with their associated target. After first dividing eQTL and mQTLs into those that were either nominally significant (P < 0.05 in either CEU or YRI, blue outline) or non-significant (P > 0.05 in both CEU and YRI, gray shading), we plotted the separation of (A) TR:TSS and (B) TR:CpG pairs for the two groups in 1 kb bins. The red line shows the frequency difference between the non-significant and significant distributions, with the significance of the enrichment determined through permutations (see ‘Materials and Methods’ section). For both eQTLs and mQTLs, significant associations are enriched for separations of <1 kb. These results mirror those from previous studies using SNPs, which have shown a strong enrichment for eQTLs occurring in close proximity to the TSS of the associated gene (43), and for mQTLs to colocalize with their associated CpG (44).
Figure 6.
Figure 6.
Significant eQTL and mQTL TRs preferentially overlap regulatory elements. We divided eQTL and mQTLs into those that were either nominally significant (P < 0.05 in either CEU or YRI, black) or non-significant (P > 0.05 in both CEU and YRI, gray), and performed overlaps with high-confidence TFBS and DHS assayed in LCLs. Significance between pairs of frequencies were calculated with the two-sided Fisher test.
Figure 7.
Figure 7.
Decay of LD between TRs and SNPs with TR length diversity. We calculated the LD (r2) between TRs and SNPs separated by <250kb, and after binning TRs based on the number of observed alleles (x-axis), plotted the maximum r2 observed for each TR in the (A) CEU and (B) YRI populations. The number of TRs represented in each boxplot is indicated in gray above the x-axis. Horizontal lines correspond to r2 = 0.8 (dashed) and the population median for all TRs analyzed (solid gray).

References

    1. Lander E.S., Linton L.M., Birren B., Nusbaum C., Zody M.C., Baldwin J., Devon K., Dewar K., Doyle M., FitzHugh W., et al. Initial sequencing and analysis of the human genome. Nature. 2001;409:860–921. - PubMed
    1. Warburton P.E., Hasson D., Guillem F., Lescale C., Jin X., Abrusan G. Analysis of the largest tandemly repeated DNA families in the human genome. BMC Genomics. 2008;9:533. - PMC - PubMed
    1. Campbell C.D., Chong J.X., Malig M., Ko A., Dumont B.L., Han L., Vives L., O'Roak B.J., Sudmant P.H., Shendure J., et al. Estimating the human mutation rate using autozygosity in a founder population. Nat. Genet. 2012;44:1277–1281. - PMC - PubMed
    1. Kondrashov A.S. Direct estimates of human per nucleotide mutation rates at 20 loci causing Mendelian diseases. Hum. Mutat. 2003;21:12–27. - PubMed
    1. Sun J.X., Helgason A., Masson G., Ebenesersdóttir S.S., Li H., Mallick S., Gnerre S., Patterson N., Kong A., Reich D., et al. A direct characterization of human mutation based on microsatellites. Nat. Genet. 2012;44:1161–1165. - PMC - PubMed

Publication types