

Generation of Novel Thyroid Cancer Stem-Like Cell Clones: Effects of Resveratrol and Valproic Acid
- PMID: 27060227
- PMCID: PMC6136064
- DOI: 10.1016/j.ajpath.2016.02.003
Generation of Novel Thyroid Cancer Stem-Like Cell Clones: Effects of Resveratrol and Valproic Acid
Abstract
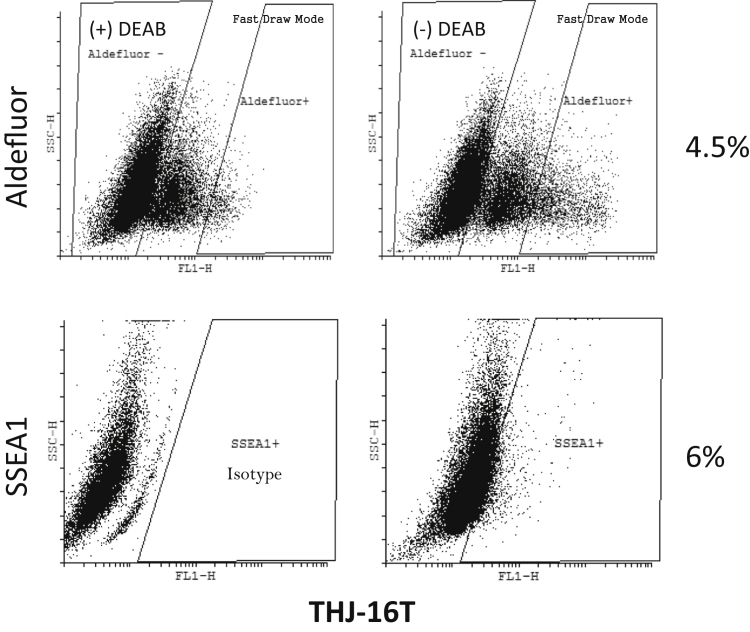
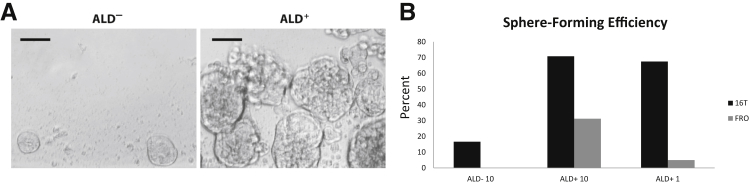
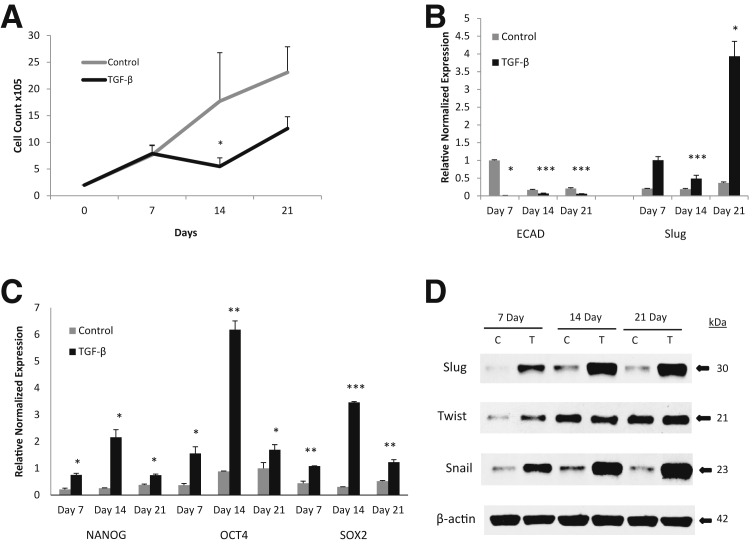
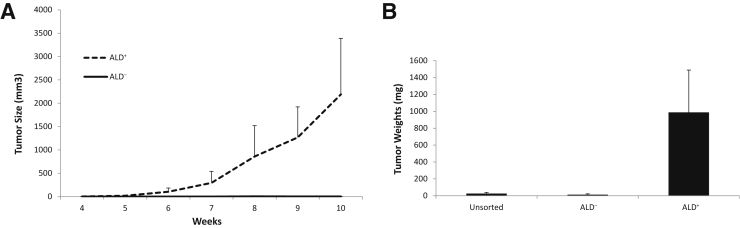
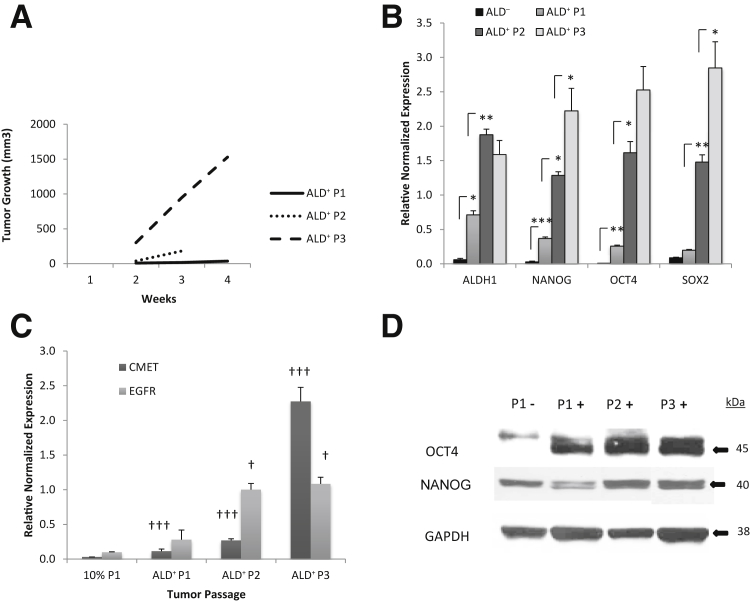
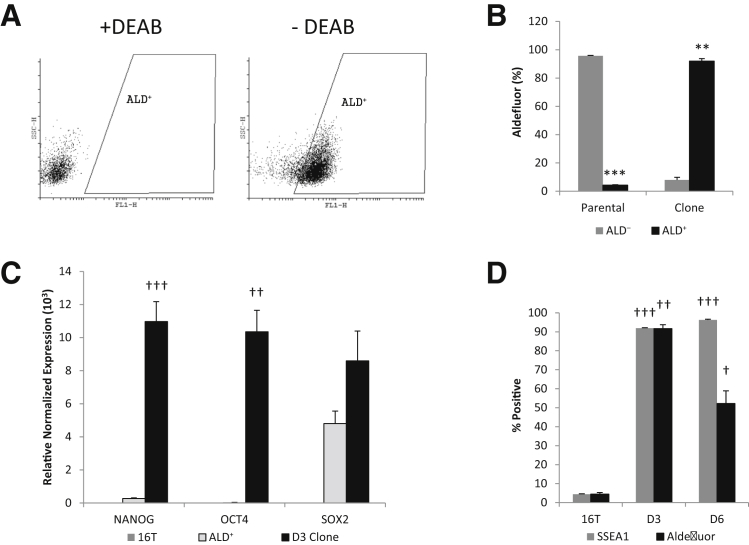
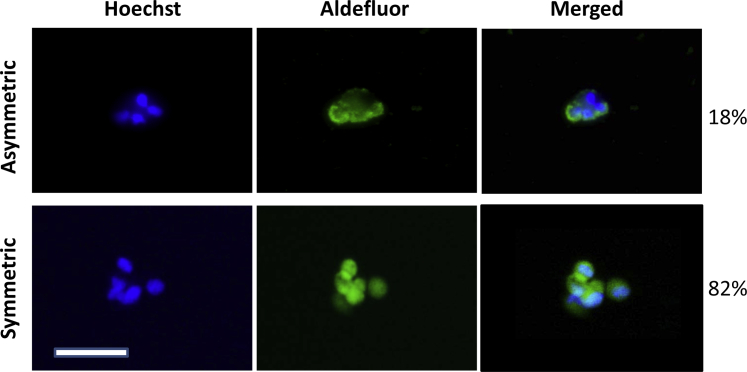
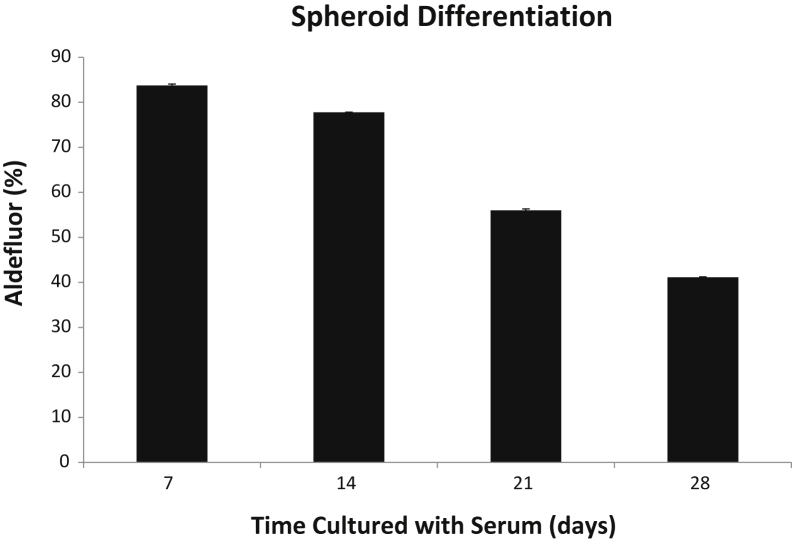
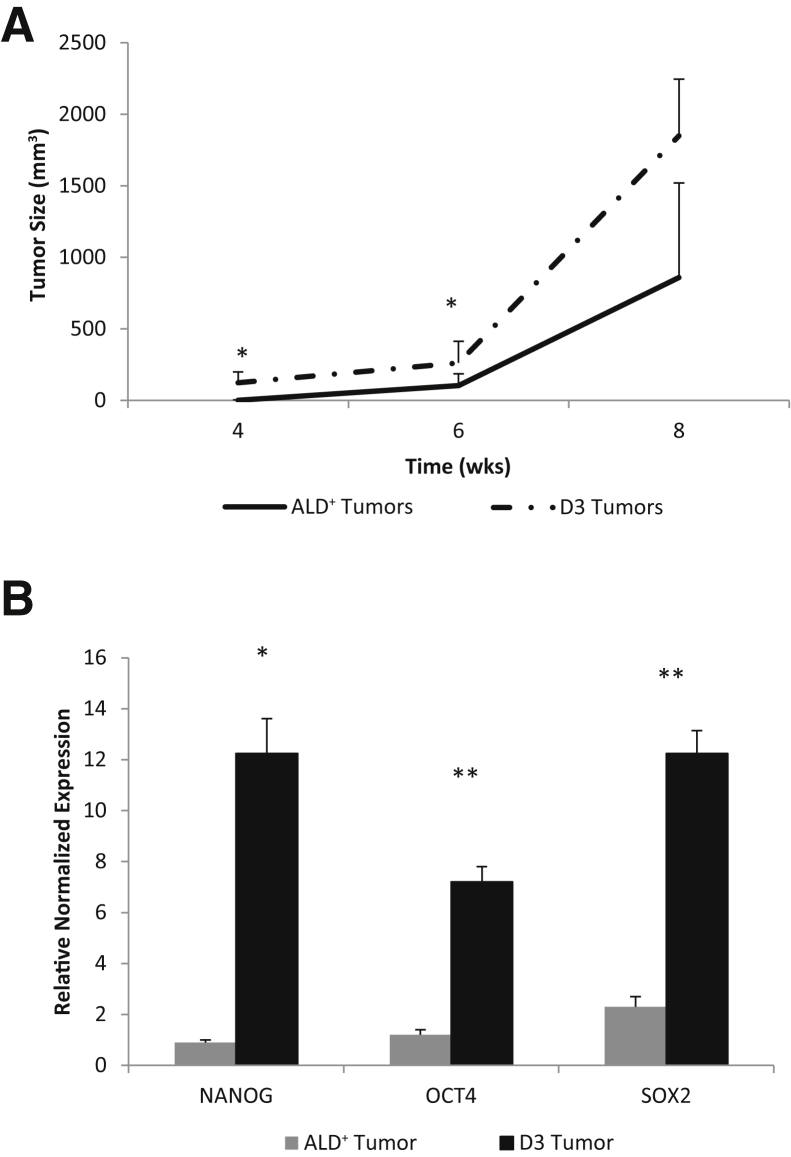
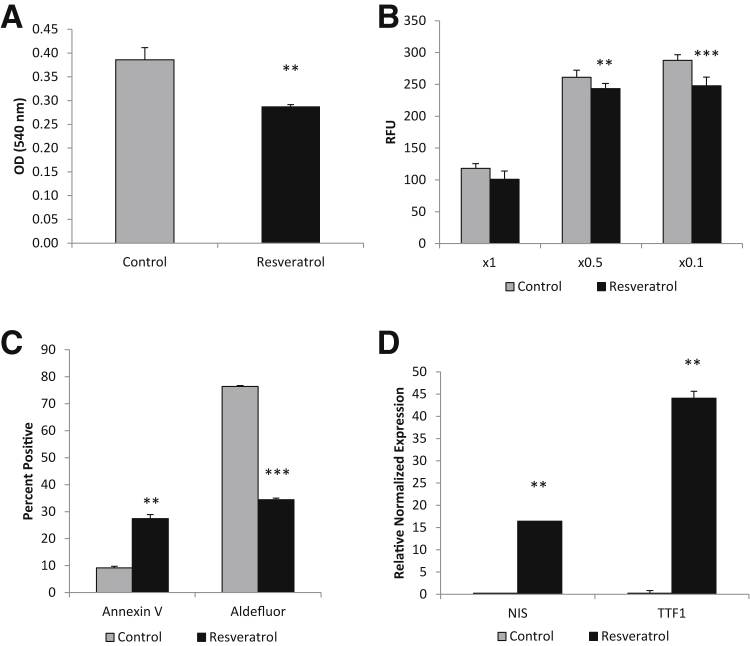
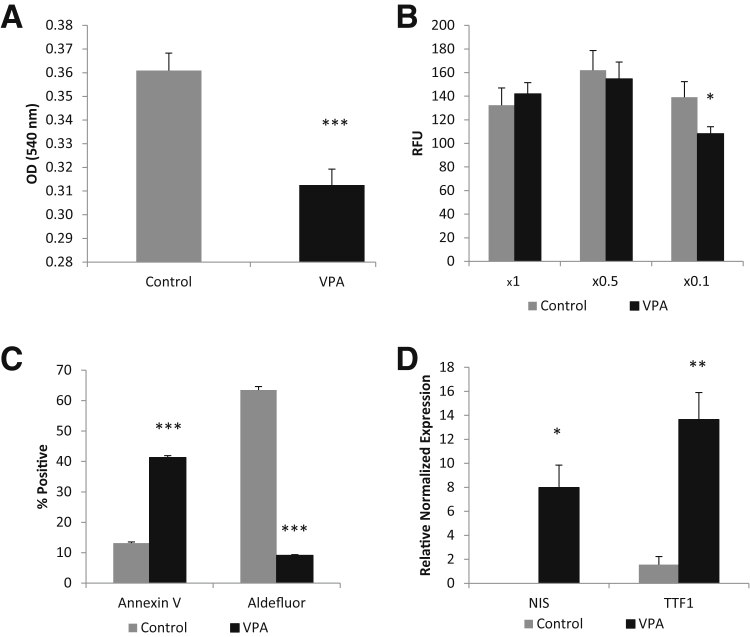
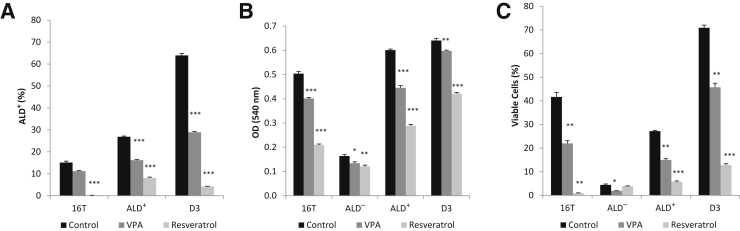
Anaplastic thyroid cancer is an aggressive and highly lethal cancer for which conventional therapies have proved ineffective. Cancer stem-like cells (CSCs) represent a small fraction of cells in the cancer that are resistant to chemotherapy and radiation therapy and are responsible for tumor reoccurrence and metastasis. We characterized CSCs in thyroid carcinomas and generated clones of CSC lines. Our study showed that anaplastic thyroid cancers had significantly more CSCs than well-differentiated thyroid cancers. We also showed that Aldefluor-positive cells revealed significantly higher expression of stem cell markers, self-renewal properties, thyrosphere formation, and enhanced tumorigenicity. In vivo passaging of Aldefluor-positive cells resulted in the growth of larger, more aggressive tumors. We isolated and generated two clonal spheroid CSC lines derived from anaplastic thyroid cancer that were even more enriched with stem cell markers and more tumorigenic than the freshly isolated Aldefluor-positive cells. Resveratrol and valproic acid treatment of one of the CSC lines resulted in a significant decrease in stem cell markers, Aldefluor expression, proliferation, and invasiveness, with an increase in apoptosis and thyroid differentiation markers, suggesting that these cell lines may be useful for discovering new adjuvant therapies for aggressive thyroid cancers. For the first time, we have two thyroid CSC lines that will be useful tools for the study of thyroid CSC targeted therapies.
Copyright © 2016 American Society for Investigative Pathology. Published by Elsevier Inc. All rights reserved.
Figures
Similar articles
-
The sonic hedgehog signaling pathway maintains the cancer stem cell self-renewal of anaplastic thyroid cancer by inducing snail expression.J Clin Endocrinol Metab. 2014 Nov;99(11):E2178-87. doi: 10.1210/jc.2014-1844. Epub 2014 Jul 31. J Clin Endocrinol Metab. 2014. PMID: 25078145 Free PMC article.
-
miR-148a inhibits self-renewal of thyroid cancer stem cells via repressing INO80 expression.Oncol Rep. 2016 Dec;36(6):3387-3396. doi: 10.3892/or.2016.5203. Epub 2016 Oct 25. Oncol Rep. 2016. PMID: 27779717
-
Cancer stem-like cell behavior in anaplastic thyroid cancer: A challenging dilemma.Life Sci. 2016 Feb 1;146:34-9. doi: 10.1016/j.lfs.2015.12.057. Epub 2016 Jan 7. Life Sci. 2016. PMID: 26772823
-
The evolving concept of cancer stem-like cells in thyroid cancer and other solid tumors.Lab Invest. 2017 Oct;97(10):1142-1151. doi: 10.1038/labinvest.2017.41. Epub 2017 Apr 10. Lab Invest. 2017. PMID: 28394318 Review.
-
Cancer stem-like cells and thyroid cancer.Endocr Relat Cancer. 2014 Oct;21(5):T285-300. doi: 10.1530/ERC-14-0002. Epub 2014 Apr 30. Endocr Relat Cancer. 2014. PMID: 24788702 Review.
Cited by
-
Therapeutic advances in anaplastic thyroid cancer: a current perspective.Mol Cancer. 2018 Oct 23;17(1):154. doi: 10.1186/s12943-018-0903-0. Mol Cancer. 2018. PMID: 30352606 Free PMC article. Review.
-
Antitumor Effect of Various Phytochemicals on Diverse Types of Thyroid Cancers.Nutrients. 2019 Jan 9;11(1):125. doi: 10.3390/nu11010125. Nutrients. 2019. PMID: 30634497 Free PMC article. Review.
-
In Silico Screening and Validation of PDGFRA Inhibitors Enhancing Radioiodine Sensitivity in Thyroid Cancer.Front Pharmacol. 2022 May 12;13:883581. doi: 10.3389/fphar.2022.883581. eCollection 2022. Front Pharmacol. 2022. PMID: 35645805 Free PMC article.
-
Thyroid cancer stem-like cell exosomes: regulation of EMT via transfer of lncRNAs.Lab Invest. 2018 Sep;98(9):1133-1142. doi: 10.1038/s41374-018-0065-0. Epub 2018 Jul 2. Lab Invest. 2018. PMID: 29967342 Free PMC article.
-
Targeting the Cancer Stem Cells in Endocrine Cancers with Phytochemicals.Curr Top Med Chem. 2022;22(31):2589-2597. doi: 10.2174/1567205020666221114112814. Curr Top Med Chem. 2022. PMID: 36380414
References
-
- Sipos J.A., Mazzaferri E.L. Thyroid cancer epidemiology and prognostic variables. Clin Oncol (R Coll Radiol) 2010;22:395–404. - PubMed
-
- Davies L., Welch H.G. Increasing incidence of thyroid cancer in the United States, 1973-2002. JAMA. 2006;295:2164–2167. - PubMed
-
- Ahn H.S., Kim H.J., Welch H.G. Korea's thyroid cancer “epidemic”: screening and overdiagnosis. N Engl J Med. 2014;371:1765–1767. - PubMed
-
- Albores-Saavedra J., Hernandez M., Sanchez-Sosa S., Simpson K., Angeles A., Henson D.E. Histologic variants of papillary and follicular carcinomas associated with anaplastic spindle and giant cell carcinomas of the thyroid: an analysis of rhabdoid and thyrogloblulin inclusions. Am J Surg Pathol. 2007;31:729–736. - PubMed
-
- Schulenburg A., Bramswig K., Herrmann H., Karlic H., Mirkina I., Hubmann R., Laffer S., Marian B., Shehata M., Krepler C., Pehamberger H., Grunt T., Jager U., Zielinski C.C., Valent P. Neoplastic stem cells: current concepts and clinical perspectives. Crit Rev Oncol Hematol. 2010;76:79–98. - PubMed
MeSH terms
Substances
Grants and funding
LinkOut - more resources
Full Text Sources
Other Literature Sources
Medical
