

Pro-inflammatory self-reactive T cells are found within murine TCR-αβ(+) CD4(-) CD8(-) PD-1(+) cells
- PMID: 27060346
- PMCID: PMC4913481
- DOI: 10.1002/eji.201546056
Pro-inflammatory self-reactive T cells are found within murine TCR-αβ(+) CD4(-) CD8(-) PD-1(+) cells
Abstract
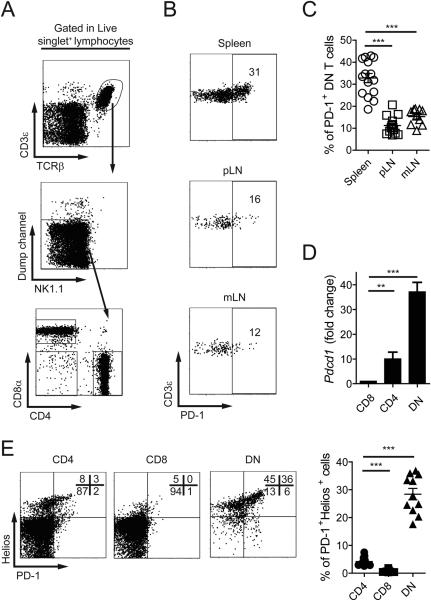
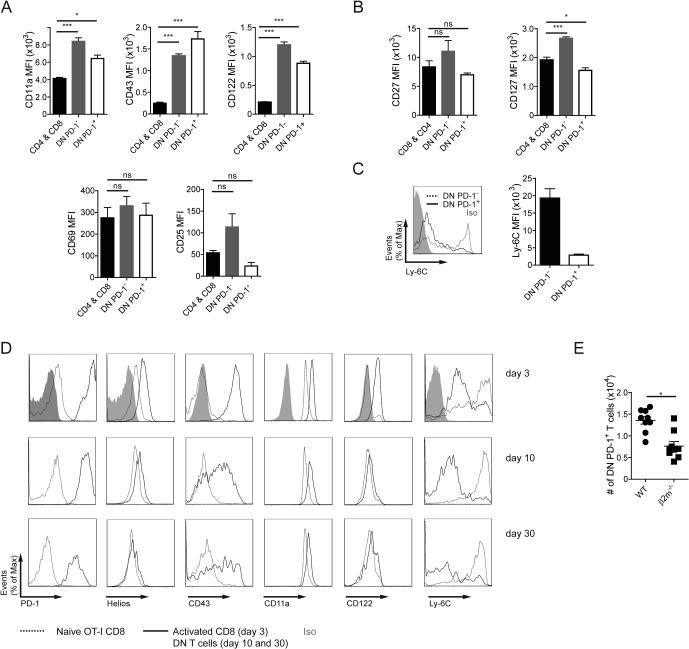
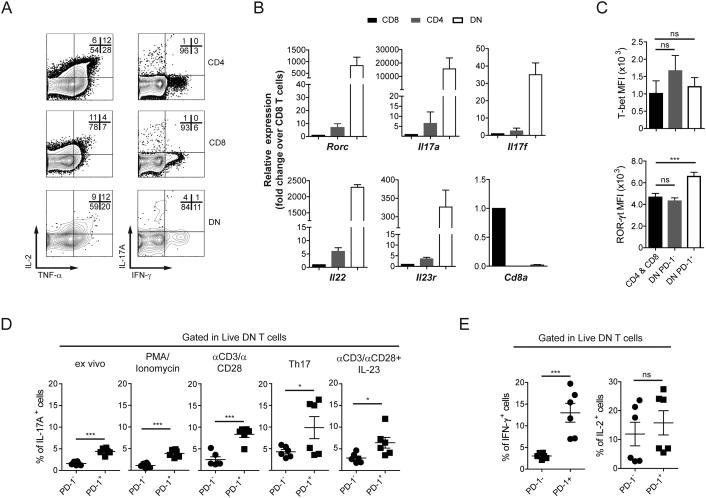
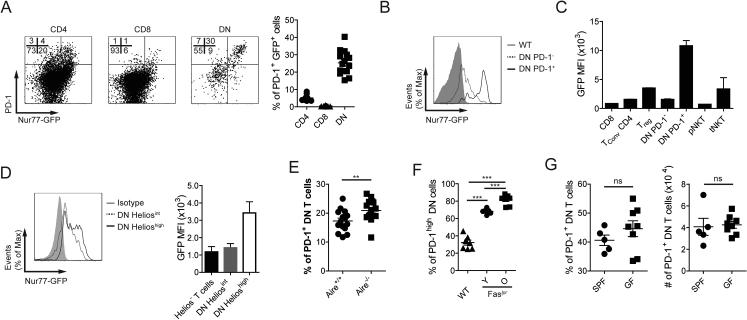
TCR-αβ(+) double negative (DN) T cells (CD3(+) TCR-αβ(+) CD4(-) CD8(-) NK1.1(-) CD49b(-) ) represent a minor heterogeneous population in healthy humans and mice. These cells have been ascribed pro-inflammatory and regulatory capacities and are known to expand during the course of several autoimmune diseases. Importantly, previous studies have shown that self-reactive CD8(+) T cells become DN after activation by self-antigens, suggesting that self-reactive T cells may exist within the DN T-cell population. Here, we demonstrate that programmed cell death 1 (PD-1) expression in unmanipulated mice identifies a subset of DN T cells with expression of activation-associated markers and a phenotype that strongly suggests they are derived from self-reactive CD8(+) cells. We also found that, within DN T cells, the PD-1(+) subset generates the majority of pro-inflammatory cytokines. Finally, using a TCR-activation reporter mouse (Nur77-GFP), we confirmed that in the steady-state PD-1(+) DN T cells engage endogenous antigens in healthy mice. In conclusion, we provide evidence that indicates that the PD-1(+) fraction of DN T cells represents self-reactive cells.
Keywords: Autoimmunity ⋅ DN T cells ⋅ IL-17 ⋅ Nur77-GFP mice ⋅ PD-1.
© 2016 WILEY-VCH Verlag GmbH & Co. KGaA, Weinheim.
Figures
Similar articles
-
Absence of programmed death receptor 1 alters thymic development and enhances generation of CD4/CD8 double-negative TCR-transgenic T cells.J Immunol. 2003 Nov 1;171(9):4574-81. doi: 10.4049/jimmunol.171.9.4574. J Immunol. 2003. PMID: 14568931
-
Programmed cell death 1 and Helios distinguish TCR-αβ+ double-negative (CD4-CD8-) T cells that derive from self-reactive CD8 T cells.J Immunol. 2015 May 1;194(9):4207-14. doi: 10.4049/jimmunol.1402775. Epub 2015 Mar 30. J Immunol. 2015. PMID: 25825451 Free PMC article.
-
TCR+CD3+CD4-CD8- effector T cells in psoriasis.Clin Immunol. 2017 Aug;181:51-59. doi: 10.1016/j.clim.2017.06.002. Epub 2017 Jun 15. Clin Immunol. 2017. PMID: 28625883
-
TCRαβ+CD3+CD4-CD8- (double negative) T cells in autoimmunity.Autoimmun Rev. 2018 Apr;17(4):422-430. doi: 10.1016/j.autrev.2018.02.001. Epub 2018 Feb 9. Autoimmun Rev. 2018. PMID: 29428806 Review.
-
CD3+CD4-CD8- alphabeta-TCR+ T cell as immune regulatory cell.J Mol Med (Berl). 2001 Aug;79(8):419-27. doi: 10.1007/s001090100238. J Mol Med (Berl). 2001. PMID: 11511972 Review.
Cited by
-
TCR-α/β CD4- CD8- double negative T cells arise from CD8+ T cells.J Leukoc Biol. 2020 Sep;108(3):851-857. doi: 10.1002/JLB.1AB0120-548R. Epub 2020 Feb 13. J Leukoc Biol. 2020. PMID: 32052478 Free PMC article.
-
Immune Phenotypes in Patients With Invasive Mould Infection Support the Use of PD-1 Inhibition as Potential Treatment Option.Mycoses. 2025 Mar;68(3):e70044. doi: 10.1111/myc.70044. Mycoses. 2025. PMID: 40095363 Free PMC article.
-
Transcriptional factor ICER promotes glutaminolysis and the generation of Th17 cells.Proc Natl Acad Sci U S A. 2018 Mar 6;115(10):2478-2483. doi: 10.1073/pnas.1714717115. Epub 2018 Feb 20. Proc Natl Acad Sci U S A. 2018. PMID: 29463741 Free PMC article.
-
Renal double negative T cells: unconventional cells in search of a function.Ann Transl Med. 2019 Dec;7(Suppl 8):S342. doi: 10.21037/atm.2019.09.107. Ann Transl Med. 2019. PMID: 32016060 Free PMC article. No abstract available.
-
Helios Expression Is Downregulated on CD8+ Treg in Two Mouse Models of Lupus During Disease Progression.Front Immunol. 2022 Jun 16;13:922958. doi: 10.3389/fimmu.2022.922958. eCollection 2022. Front Immunol. 2022. PMID: 35784310 Free PMC article.
References
-
- Anderson MS, Venanzi ES, Chen Z, Berzins SP, Benoist C, Mathis D. The cellular mechanism of Aire control of T cell tolerance. Immunity. 2005;23:227–39. - PubMed
-
- Maeda Y, Nishikawa H, Sugiyama D, Ha D, Hamaguchi M, Saito T, Nishioka M, et al. Detection of self-reactive CD8+ T cells with an anergic phenotype in healthy individuals. Science. 2014;346:1536–40. - PubMed
-
- Tsokos GC. Systemic lupus erythematosus. N. Engl. J. Med. 2011;365:2110–21. - PubMed
Publication types
MeSH terms
Substances
Grants and funding
LinkOut - more resources
Full Text Sources
Other Literature Sources
Molecular Biology Databases
Research Materials
