

Hyper-connectivity of functional networks for brain disease diagnosis
- PMID: 27060621
- PMCID: PMC5333488
- DOI: 10.1016/j.media.2016.03.003
Hyper-connectivity of functional networks for brain disease diagnosis
Abstract
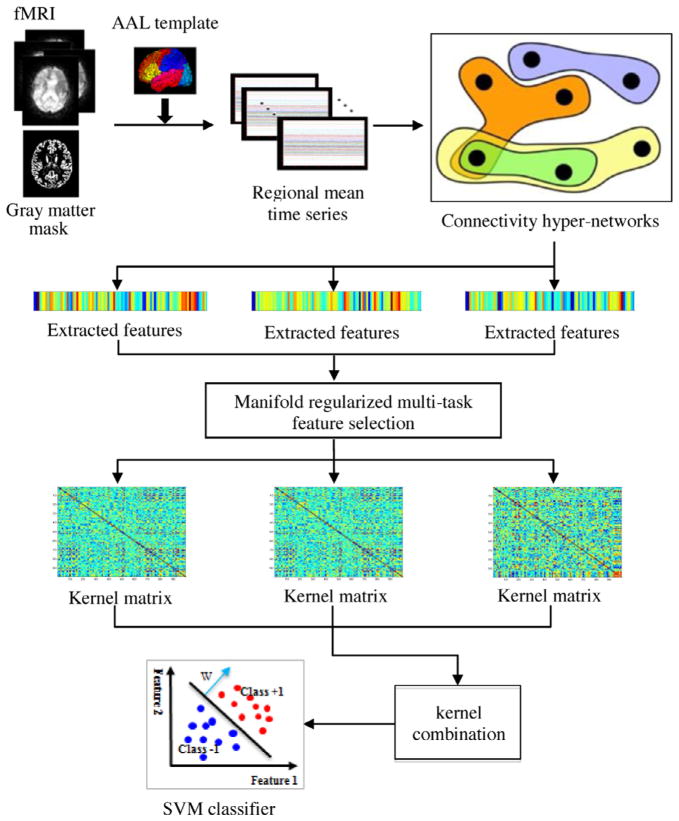
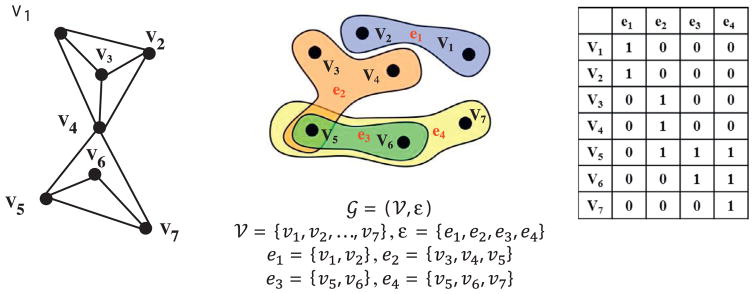
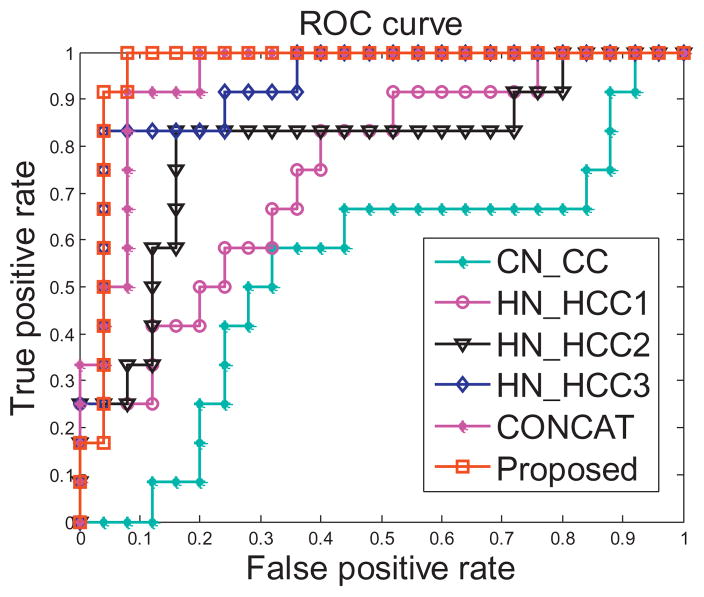
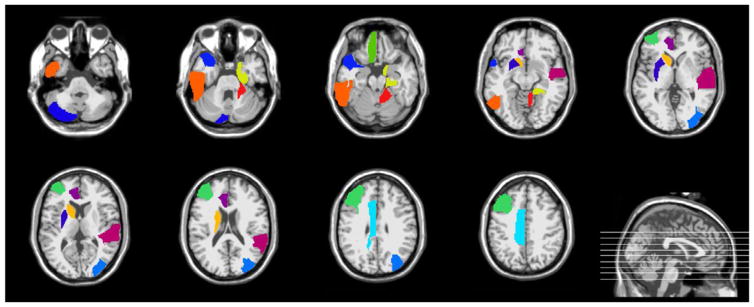
Exploring structural and functional interactions among various brain regions enables better understanding of pathological underpinnings of neurological disorders. Brain connectivity network, as a simplified representation of those structural and functional interactions, has been widely used for diagnosis and classification of neurodegenerative diseases, especially for Alzheimer's disease (AD) and its early stage - mild cognitive impairment (MCI). However, the conventional functional connectivity network is usually constructed based on the pairwise correlation among different brain regions and thus ignores their higher-order relationships. Such loss of high-order information could be important for disease diagnosis, since neurologically a brain region predominantly interacts with more than one other brain regions. Accordingly, in this paper, we propose a novel framework for estimating the hyper-connectivity network of brain functions and then use this hyper-network for brain disease diagnosis. Here, the functional connectivity hyper-network denotes a network where each of its edges representing the interactions among multiple brain regions (i.e., an edge can connect with more than two brain regions), which can be naturally represented by a hyper-graph. Specifically, we first construct connectivity hyper-networks from the resting-state fMRI (R-fMRI) time series by using sparse representation. Then, we extract three sets of brain-region specific features from the connectivity hyper-networks, and further exploit a manifold regularized multi-task feature selection method to jointly select the most discriminative features. Finally, we use multi-kernel support vector machine (SVM) for classification. The experimental results on both MCI dataset and attention deficit hyperactivity disorder (ADHD) dataset demonstrate that, compared with the conventional connectivity network-based methods, the proposed method can not only improve the classification performance, but also help discover disease-related biomarkers important for disease diagnosis.
Keywords: Alzheimer's disease; Classification; Functional MR imaging; Hyper-network.
Copyright © 2016 Elsevier B.V. All rights reserved.
Figures
Similar articles
-
Brain connectivity hyper-network for MCI classification.Med Image Comput Comput Assist Interv. 2014;17(Pt 2):724-32. doi: 10.1007/978-3-319-10470-6_90. Med Image Comput Comput Assist Interv. 2014. PMID: 25485444
-
Multimodal Hyper-connectivity Networks for MCI Classification.Med Image Comput Comput Assist Interv. 2017 Sep;10433:433-441. doi: 10.1007/978-3-319-66182-7_50. Epub 2017 Sep 4. Med Image Comput Comput Assist Interv. 2017. PMID: 29568824 Free PMC article.
-
Application of advanced machine learning methods on resting-state fMRI network for identification of mild cognitive impairment and Alzheimer's disease.Brain Imaging Behav. 2016 Sep;10(3):799-817. doi: 10.1007/s11682-015-9448-7. Brain Imaging Behav. 2016. PMID: 26363784
-
A survey on applications and analysis methods of functional magnetic resonance imaging for Alzheimer's disease.J Neurosci Methods. 2019 Apr 1;317:121-140. doi: 10.1016/j.jneumeth.2018.12.012. Epub 2018 Dec 26. J Neurosci Methods. 2019. PMID: 30593787 Review.
-
Machine Learning Techniques for the Diagnosis of Attention-Deficit/Hyperactivity Disorder from Magnetic Resonance Imaging: A Concise Review.Neurol India. 2021 Nov-Dec;69(6):1518-1523. doi: 10.4103/0028-3886.333520. Neurol India. 2021. PMID: 34979636 Review.
Cited by
-
Classify patients with Moyamoya disease according to their cognitive performance might be helpful in clinical and practical with support vector machine based on hypergraph.Hum Brain Mapp. 2023 Apr 15;44(6):2407-2417. doi: 10.1002/hbm.26218. Epub 2023 Feb 17. Hum Brain Mapp. 2023. PMID: 36799621 Free PMC article.
-
Increased functional connectivity patterns in mild Alzheimer's disease: A rsfMRI study.Front Aging Neurosci. 2023 Jan 9;14:1037347. doi: 10.3389/fnagi.2022.1037347. eCollection 2022. Front Aging Neurosci. 2023. PMID: 36698861 Free PMC article.
-
Discovering network phenotype between genetic risk factors and disease status via diagnosis-aligned multi-modality regression method in Alzheimer's disease.Bioinformatics. 2019 Jun 1;35(11):1948-1957. doi: 10.1093/bioinformatics/bty911. Bioinformatics. 2019. PMID: 30395195 Free PMC article.
-
A toolbox for brain network construction and classification (BrainNetClass).Hum Brain Mapp. 2020 Jul;41(10):2808-2826. doi: 10.1002/hbm.24979. Epub 2020 Mar 12. Hum Brain Mapp. 2020. PMID: 32163221 Free PMC article.
-
Diagnosis of Autism Spectrum Disorders Using Multi-Level High-Order Functional Networks Derived From Resting-State Functional MRI.Front Hum Neurosci. 2018 May 14;12:184. doi: 10.3389/fnhum.2018.00184. eCollection 2018. Front Hum Neurosci. 2018. PMID: 29867410 Free PMC article.
References
-
- Argyriou A, Evgeniou T, Pontil M. Convex multi-task feature learning. Mach Learn. 2008;73:243–272.
-
- Bai F, Zhang Z, Watson DR, Yu H, Shi Y, Yuan Y, et al. Abnormal functional connectivity of hippocampus during episodic memory retrieval processing network in amnestic mild cognitive impairment. Biol Psychiatry. 2009;65:951–958. - PubMed
-
- Baldacara L, Borgio JG, Moraes WA, Lacerda AL, Montano MB, Tufik S, et al. Cerebellar volume in patients with dementia. Rev Bras Psiquiatr. 2011;33:122–129. - PubMed
-
- Bell-McGinty S, Lopez OL, Meltzer CC, Scanlon JM, Whyte EM, Dekosky ST, et al. Differential cortical atrophy in subgroups of mild cognitive impairment. Arch Neurol. 2005;62:1393–1397. - PubMed
MeSH terms
Grants and funding
LinkOut - more resources
Full Text Sources
Other Literature Sources
Medical
