

Efficacy and safety of liraglutide versus sitagliptin, both in combination with metformin, in Chinese patients with type 2 diabetes: a 26-week, open-label, randomized, active comparator clinical trial
- PMID: 27060930
- PMCID: PMC5084818
- DOI: 10.1111/dom.12674
Efficacy and safety of liraglutide versus sitagliptin, both in combination with metformin, in Chinese patients with type 2 diabetes: a 26-week, open-label, randomized, active comparator clinical trial
Abstract
Aims: To compare the efficacy and safety of liraglutide versus sitagliptin as add-on to metformin after 26 weeks of treatment in Chinese patients with type 2 diabetes mellitus (T2DM).
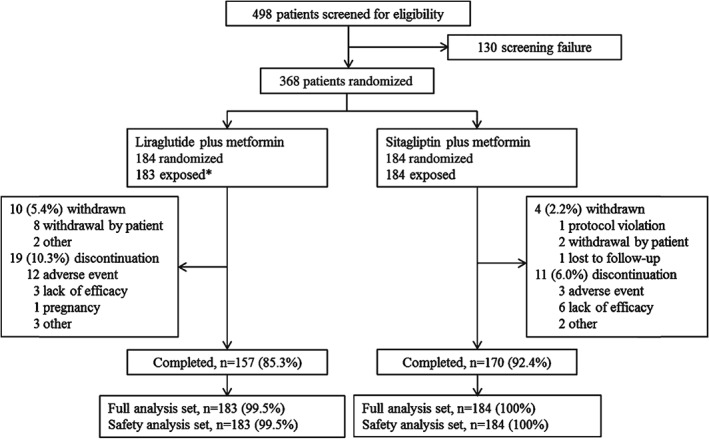
Methods: This 26-week open-label, active comparator trial (NCT02008682) randomized patients (aged 18-80 years) with T2DM inadequately controlled with metformin [glycated haemoglobin (HbA1c) 7.0-10.0% (53-86 mmol/mol)] 1 : 1 to once-daily subcutaneously administered liraglutide 1.8 mg (n = 184) or once-daily oral sitagliptin 100 mg (n = 184), both as add-on to metformin. The primary endpoint was change in HbA1c from baseline to week 26.
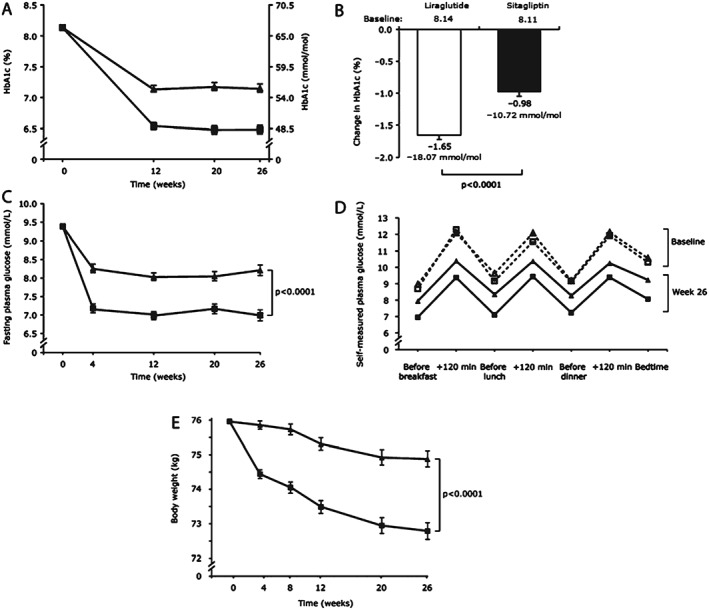
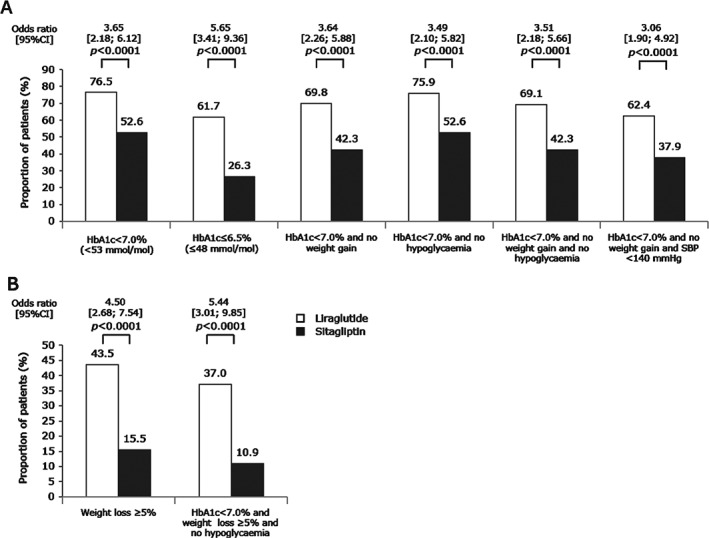
Results: Liraglutide was superior to sitagliptin in reducing HbA1c from baseline [8.1% (65 mmol/mol)] to 26 weeks, as evidenced by estimated mean HbA1c change of -1.65% (-18.07 mmol/mol) versus -0.98% (-10.72 mmol/mol), respectively [estimated treatment difference for liraglutide vs sitagliptin of -0.67% (95% CI -0.86, -0.48) or -7.35 mmol/mol (95% CI -9.43; -5.26); p < 0.0001]. More patients receiving liraglutide (76.5%) than sitagliptin (52.6%) achieved the HbA1c target of <7.0% (53 mmol/mol) at week 26 [odds ratio 3.65 (95% CI 2.18, 6.12); p < 0.0001]. Reductions in fasting plasma glucose, 7-point self-measured plasma glucose and body weight were greater with liraglutide than with sitagliptin (p < 0.0001 for all). More patients experienced nausea (14.8% vs 0.5%), diarrhoea (8.2% vs 2.2%) and decreased appetite (10.9% vs 0.5%) with liraglutide than sitagliptin. Two hypoglycaemic episodes were confirmed for liraglutide and one for sitagliptin; none were severe or nocturnal.
Conclusions: Liraglutide provided better glycaemic control and greater body weight reduction than sitagliptin when administered as add-on to metformin. More patients had nausea, diarrhoea and decreased appetite with liraglutide versus sitagliptin.
Keywords: Chinese; liraglutide; sitagliptin; type 2 diabetes.
© 2016 The Authors. Diabetes, Obesity and Metabolism published by John Wiley & Sons Ltd.
Figures
Similar articles
-
Efficacy and safety of switching from sitagliptin to liraglutide in subjects with type 2 diabetes (LIRA-SWITCH): a randomized, double-blind, double-dummy, active-controlled 26-week trial.Diabetes Obes Metab. 2016 Dec;18(12):1191-1198. doi: 10.1111/dom.12736. Epub 2016 Sep 14. Diabetes Obes Metab. 2016. PMID: 27381275 Free PMC article. Clinical Trial.
-
Efficacy and safety over 26 weeks of an oral treatment strategy including sitagliptin compared with an injectable treatment strategy with liraglutide in patients with type 2 diabetes mellitus inadequately controlled on metformin: a randomised clinical trial.Diabetologia. 2013 Jul;56(7):1503-11. doi: 10.1007/s00125-013-2905-1. Epub 2013 Apr 19. Diabetologia. 2013. PMID: 23604551 Clinical Trial.
-
Fixed-Dose Combination of Dapagliflozin + Sitagliptin + Metformin in Patients with Type 2 Diabetes Poorly Controlled with Metformin: Phase 3, Randomized Comparison with Dual Combinations.Adv Ther. 2023 Jul;40(7):3227-3246. doi: 10.1007/s12325-023-02523-z. Epub 2023 May 31. Adv Ther. 2023. PMID: 37258803 Clinical Trial.
-
Long-term efficacy and safety comparison of liraglutide, glimepiride and placebo, all in combination with metformin in type 2 diabetes: 2-year results from the LEAD-2 study.Diabetes Obes Metab. 2013 Mar;15(3):204-12. doi: 10.1111/dom.12012. Epub 2012 Oct 11. Diabetes Obes Metab. 2013. PMID: 22985213 Review.
-
Glycaemic control with liraglutide: the phase 3 trial programme.Int J Clin Pract Suppl. 2010 Oct;(167):21-7. doi: 10.1111/j.1742-1241.2010.02496.x. Int J Clin Pract Suppl. 2010. PMID: 20887301 Review.
Cited by
-
Cardiovascular risk of sitagliptin in treating patients with type 2 diabetes mellitus.Biosci Rep. 2019 Jul 15;39(7):BSR20190980. doi: 10.1042/BSR20190980. Print 2019 Jul 31. Biosci Rep. 2019. PMID: 31262972 Free PMC article. Review.
-
Cost-effectiveness of empagliflozin in patients with type 2 diabetes and established cardiovascular disease in China.Cost Eff Resour Alloc. 2021 Aug 4;19(1):46. doi: 10.1186/s12962-021-00299-z. Cost Eff Resour Alloc. 2021. PMID: 34348729 Free PMC article.
-
[Comparison of therapeutic effect of metformin hydrochloride/vildagliptin and liraglutide on type 2 diabetes mellitus in obese patients].Nan Fang Yi Ke Da Xue Xue Bao. 2023 Mar 20;43(3):436-442. doi: 10.12122/j.issn.1673-4254.2023.03.14. Nan Fang Yi Ke Da Xue Xue Bao. 2023. PMID: 37087589 Free PMC article. Chinese.
-
Risk of Malignant Neoplasia with Glucagon-Like Peptide-1 Receptor Agonist Treatment in Patients with Type 2 Diabetes: A Meta-Analysis.J Diabetes Res. 2019 Jul 16;2019:1534365. doi: 10.1155/2019/1534365. eCollection 2019. J Diabetes Res. 2019. PMID: 31396537 Free PMC article.
-
Gastrointestinal adverse events with insulin glargine/lixisenatide fixed-ratio combination versus glucagon-like peptide-1 receptor agonists in people with type 2 diabetes mellitus: A network meta-analysis.Diabetes Obes Metab. 2021 Jan;23(1):136-146. doi: 10.1111/dom.14202. Epub 2020 Oct 22. Diabetes Obes Metab. 2021. PMID: 32991041 Free PMC article.
References
-
- Yang W, Lu J, Weng J et al. Prevalence of diabetes among men and women in China. N Engl J Med 2010; 362: 1090–1101. - PubMed
-
- Xu Y, Wang L, He J et al. Prevalence and control of diabetes in Chinese adults. JAMA 2013; 310: 948–959. - PubMed
-
- Inzucchi SE, Bergenstal RM, Buse JB et al. Management of hyperglycemia in type 2 diabetes, 2015: a patient‐centered approach: update to a position statement of the American Diabetes Association and the European Association for the Study of Diabetes. Diabetes Care 2015; 38: 140–149. - PubMed
-
- Hayward RA, Reaven PD, Wiitala WL et al. Follow‐up of glycemic control and cardiovascular outcomes in type 2 diabetes. N Engl J Med 2015; 372: 2197–2206. Erratum in: N Engl J Med 2015; 373: 198.. - PubMed
Publication types
MeSH terms
Substances
LinkOut - more resources
Full Text Sources
Other Literature Sources
Medical
