. 2016 Jul;239(3):286-96.
doi: 10.1002/path.4727. Epub 2016 May 25.

Anti-stromal treatment together with chemotherapy targets multiple signalling pathways in pancreatic adenocarcinoma

Affiliations

Anti-stromal treatment together with chemotherapy targets multiple signalling pathways in pancreatic adenocarcinoma

Elisabete F Carapuça et al. J Pathol. 2016 Jul.

Abstract

Stromal targeting for pancreatic ductal adenocarcinoma (PDAC) is rapidly becoming an attractive option, due to the lack of efficacy of standard chemotherapy and increased knowledge about PDAC stroma. We postulated that the addition of stromal therapy may enhance the anti-tumour efficacy of chemotherapy. Gemcitabine and all-trans retinoic acid (ATRA) were combined in a clinically applicable regimen, to target cancer cells and pancreatic stellate cells (PSCs) respectively, in 3D organotypic culture models and genetically engineered mice (LSL-Kras(G12D) (/+) ;LSL-Trp53(R172H) (/+) ;Pdx-1-Cre: KPC mice) representing the spectrum of PDAC. In two distinct sets of organotypic models as well as KPC mice, we demonstrate a reduction in cancer cell proliferation and invasion together with enhanced cancer cell apoptosis when ATRA is combined with gemcitabine, compared to vehicle or either agent alone. Simultaneously, PSC activity (as measured by deposition of extracellular matrix proteins such as collagen and fibronectin) and PSC invasive ability were both diminished in response to combination therapy. These effects were mediated through a range of signalling cascades (Wnt, hedgehog, retinoid, and FGF) in cancer as well as stellate cells, affecting epithelial cellular functions such as epithelial-mesenchymal transition, cellular polarity, and lumen formation. At the tissue level, this resulted in enhanced tumour necrosis, increased vascularity, and diminished hypoxia. Consequently, there was an overall reduction in tumour size. The enhanced effect of stromal co-targeting (ATRA) alongside chemotherapy (gemcitabine) appears to be mediated by dampening multiple signalling cascades in the tumour-stroma cross-talk, rather than ablating stroma or targeting a single pathway. © 2016 The Authors. The Journal of Pathology published by John Wiley & Sons Ltd on behalf of Pathological Society of Great Britain and Ireland.

Keywords: all-trans-retinoic acid; collagen; fibronectin; gemcitabine; pancreatic stellate cells; quiescence.


Figures

Figure 1
Figure 1
Cancer cell proliferation and apoptosis after combination treatment with gemcitabine and ATRA. Summary data from organotypic cultures (OT) and LSL‐KrasG12D/+;LSL‐Trp53R172H/+;Pdx‐1‐Cre mice (KPC mice) treated with either vehicle, gemcitabine alone, ATRA alone or a combination of gemcitabine with ATRA, as shown by median and interquartile range as box and whisker (min–max) plots. All observations were normalized to controls (vehicle). Nine to 15 experimental replicates were carried out for OT, resulting in 35–50 high‐power field measurements. Five to six mice per group were enrolled to allow assessments in 10–30 high‐power fields. Comparisons were made by the Kruskal–Wallis test followed by Dunn's post‐hoc analysis. ***p < 0.001; **p < 0.01; *p < 0.05. PSC = pancreatic stellate cell. (A–C) Cancer cell proliferation index in organotypics (A, B) and KPC mice (C). (D–F) Cancer cell apoptotic index in organotypics (D, E) and KPC mice (F). See supplementary material, Figure S3 for representative images.
Figure 2
Figure 2
Invasion of cancer and stellate cells after combination treatment with gemcitabine and ATRA. Summary data from organotypic cultures (OT) and LSL‐KrasG12D/+;LSL‐Trp53R172H/+;Pdx‐1‐Cre mice (KPC mice) treated with either vehicle, gemcitabine alone, ATRA alone or a combination of gemcitabine with ATRA, as shown by median and interquartile range as box and whisker (min–max) plots. All observations were normalized to controls (vehicle). Nine to 15 experimental replicates were carried out for OT, resulting in 35–50 high‐power field measurements. Five to six mice per group were enrolled to allow assessments in ten high‐power fields. Comparisons were made by the Kruskal–Wallis test followed by Dunn's post‐hoc analysis. ***p < 0.001; **p < 0.01; *p < 0.05. PCC = pancreatic cancer cell; PSC = pancreatic stellate cell. (A, B) Cancer cell invasion index in organotypics. (C, D) Stellate cell invasion index in an organotypic model. (E) Stellate cell density in KPC mice. Stellate cell density in KPC was determined as green signal pixel intensity per area; the number of stellate cells was not counted, as it was not possible to identify accurately this cell type in the KPC tumour sections. See supplementary material, Figure S4 for representative images.
Figure 3
Figure 3
Pancreatic stellate cell activity, vascularity, and hypoxia after combination treatment with gemcitabine and ATRA. Summary data from organotypic cultures (OT) and LSL‐KrasG12D/+;LSL‐Trp53R172H/+;Pdx‐1‐Cre mice (KPC mice) treated with either vehicle, gemcitabine alone, ATRA alone or a combination of gemcitabine with ATRA, as shown by median and interquartile range as box and whisker (min–max) plots. All observations were normalized to controls (vehicle). Nine to 15 experimental replicates were carried out for organotypics, resulting in 35–50 high‐power field measurements. Five to six mice per group were enrolled to allow assessments in 10–30 high‐power fields. Comparisons were made by the Kruskal–Wallis test followed by Dunn's post‐hoc analysis. ***p < 0.001; **p < 0.01; *p < 0.05. PSC = pancreatic stellate cell. (A–D) Stellate cell activity in terms of fibronectin deposition in an organotypic model (A, B) and KPC mice (C) and in terms of collagen I deposition in the KPC mouse model (D). (E) Vascular density as determined by endomucin stain in the KPC mouse model. (F) Hypoxic index as determined by GLUT‐1 stain. See supplementary material, Figures S5 and 6 for representative images.
Figure 4
Figure 4
Effect of combination treatment with gemcitabine and ATRA on tumour growth and gemcitabine and ATRA intra‐tumoural levels in KPC mice. (A) Percentage necrotic area as determined by H&E staining. Summary data from LSL‐KrasG12D/+;LSL‐Trp53R172H/+;Pdx‐1‐Cre mice (KPC mice) treated with either vehicle, gemcitabine alone, ATRA alone or a combination of gemcitabine with ATRA, as shown by median and interquartile range as box and whisker (min–max) plots. Five to six mice per group were enrolled. Comparisons were made by the Kruskal–Wallis test followed by Dunn's post‐hoc analysis. ***p < 0.001; **p < 0.01; *p < 0.05. See supplementary material, Figure S6C for representative images. (B) Percentage change in tumour volume between pre‐treatment (day −2) and post‐treatment (day 7) was measured by ultrasound in the KPC mouse model. (C) Serum and pancreatic tumour ATRA concentration demonstrated a correlation in mice receiving ATRA treatment [Pearson's correlation coefficient 0.66 (95% CI 0.09–0.9)]. A regression line and its 95% confidence interval are shown. (D) Tumour tissue ATRA concentration in KPC mice treated with ATRA or gemcitabine/ATRA. (E) Tumour tissue gemcitabine metabolites in gemcitabine‐ and gemcitabine/ATRA‐treated mice. ns = not significant.
Figure 5
Figure 5
The combination of gemcitabine with ATRA affects multiple signalling cascades in cancer cells and stroma in organotypic cultures and KPC mice. Summary data from organotypic cultures (OT) and LSL‐KrasG12D/+;LSL‐Trp53R172H/+;Pdx‐1‐Cre mice (KPC mice) treated with either vehicle, gemcitabine alone, ATRA alone or a combination of gemcitabine with ATRA, as shown by median and interquartile range as box and whisker (min–max) plots. All observations were normalized to controls (vehicle). Sections from three experimental replicates were carried out for organotypics, resulting in 18 high‐power field measurements. Three mice per group were selected to allow assessments in ten high‐power fields per section. Comparisons were made by the Kruskal–Wallis test followed by Dunn's post‐hoc analysis. ***p < 0.001; *p < 0.05. (A–C) FGF2 nuclear expression index in organotypics and KPC mice. (D–F) FGFR1 nuclear expression index in organotypics and KPC mice. (G) RARβ nuclear expression index in KPC mice. (H) sFRP4 stromal expression index in KPC mice. See supplementary material, Figures S7–9 for representative images.
Figure 6
Figure 6
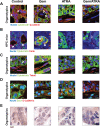
The combination of gemcitabine with ATRA affects apical polarity, epithelial–mesenchymal transition, and hedgehog signalling in cancer cells within organotypic cultures and KPC mice. Representative images from organotypic cultures (OT) and LSL‐KrasG12D/+;LSL‐Trp53R172H/+;Pdx‐1‐Cre mice (KPC mice), as indicated, treated with either vehicle, gemcitabine alone, ATRA alone or the combination of gemcitabine with ATRA. Bold arrowheads indicate positive stain and other arrowheads indicate negative stain. (A) Capan‐1 cells stained with anti‐cytokeratin (green) and anti‐β‐catenin (red) antibodies were used to localize β‐catenin in organotypic cultures. Cytokeratin‐positive cancer cells demonstrate loss of nuclear β‐catenin in ATRA‐treated organotypic cultures. See supplementary material, Figure S10 for detailed data on KPC mice and organotypic cultures. Scale bar = 10 µm. (B) Anti‐cytokeratin (green) and anti‐ezrin (red) antibodies were used to localize ezrin in KPC mice. Cytokeratin‐positive cancer cells demonstrate loss of membranous ezrin in ATRA‐treated murine tissues. See supplementary material, Figure S11 for detailed data on KPC mice and organotypic cultures. (C) Anti‐cytokeratin (green) and anti‐TWIST1 (red) antibodies were used to localize TWIST1 in Capan‐1/PS1 organotypic cultures. Cytokeratin‐positive cancer cells demonstrate loss of nuclear TWIST1 in ATRA organotypic cultures. Cytokeratin‐negative PSCs demonstrate nuclear TWIST1 to act as an internal positive control. See supplementary material, Figure S12 for detailed data on KPC mice and organotypic cultures. (D) Anti‐ZEB1 (green) and anti‐E‐cadherin (red) antibodies were used to localize ZEB1 in Capan‐1/PS1 organotypic cultures. E‐cadherin‐positive cancer cells demonstrate loss of nuclear ZEB1 in ATRA organotypic cultures. E‐cadherin‐negative PSCs demonstrate nuclear ZEB1 to act as an internal positive control. See supplementary material, Figure S13 for detailed data on KPC mice and organotypic cultures. (E) In KPC mice, anti‐Gli1 staining (brown) was used to localize Gli1 expression. Loss of nuclear Gli1 in epithelial‐appearing cells was demonstrable within ATRA‐treated murine PDAC tissues. See supplementary material, Figure S14 for detailed data on KPC mice. Scale bar = 10 µm.

References

    1. Conroy T, Desseigne F, Ychou M, et al. FOLFIRINOX versus gemcitabine for metastatic pancreatic cancer. N Engl J Med 2011; 364 : 1817–1825. - PubMed
    1. Von Hoff DD, Ervin T, Arena FP, et al. Increased survival in pancreatic cancer with nab‐paclitaxel plus gemcitabine. N Engl J Med 2013; 369 : 1691–1703. - PMC - PubMed
    1. National Institute for Health and Care Excellence . The use of gemcitabine for the treatment of pancreatic cancer (TA25). 2001. [Accessed 1 February 2016]. Available from: https://www.nice.org.uk/guidance/ta25
    1. Neesse A, Algul H, Tuveson DA, et al. Stromal biology and therapy in pancreatic cancer: a changing paradigm. Gut 2015; 64 : 1476–1484. - PubMed
    1. Neesse A, Michl P, Frese KK, et al. Stromal biology and therapy in pancreatic cancer. Gut 2011; 60: 861–868. - PubMed

Publication types

MeSH terms