

Use of Population-based Data to Demonstrate How Waitlist-based Metrics Overestimate Geographic Disparities in Access to Liver Transplant Care
- PMID: 27062327
- PMCID: PMC5055842
- DOI: 10.1111/ajt.13820
Use of Population-based Data to Demonstrate How Waitlist-based Metrics Overestimate Geographic Disparities in Access to Liver Transplant Care
Abstract
Liver allocation policies are evaluated by how they impact waitlisted patients, without considering broader outcomes for all patients with end-stage liver disease (ESLD) not on the waitlist. We conducted a retrospective cohort study using two nationally representative databases: HealthCore (2006-2014) and five-state Medicaid (California, Florida, New York, Ohio and Pennsylvania; 2002-2009). United Network for Organ Sharing (UNOS) linkages enabled ascertainment of waitlist- and transplant-related outcomes. We included patients aged 18-75 with ESLD (decompensated cirrhosis or hepatocellular carcinoma) using validated International Classification of Diseases, Ninth Revision (ICD-9)-based algorithms. Among 16 824 ESLD HealthCore patients, 3-year incidences of waitlisting and transplantation were 15.8% (95% confidence interval [CI] : 15.0-16.6%) and 8.1% (7.5-8.8%), respectively. Among 67 706 ESLD Medicaid patients, 3-year incidences of waitlisting and transplantation were 10.0% (9.7-10.4%) and 6.7% (6.5-7.0%), respectively. In HealthCore, the absolute ranges in states' waitlist mortality and transplant rates were larger than corresponding ranges among all ESLD patients (waitlist mortality: 13.6-38.5%, ESLD 3-year mortality: 48.9-62.0%; waitlist transplant rates: 36.3-72.7%, ESLD transplant rates: 4.8-13.4%). States' waitlist mortality and ESLD population mortality were not positively correlated: ρ = -0.06, p-value = 0.83 (HealthCore); ρ = -0.87, p-value = 0.05 (Medicaid). Waitlist and ESLD transplant rates were weakly positively correlated in Medicaid (ρ = 0.36, p-value = 0.55) but were positively correlated in HealthCore (ρ = 0.73, p-value = 0.001). Compared to population-based metrics, waitlist-based metrics overestimate geographic disparities in access to liver transplantation.
Keywords: disparities; epidemiology; ethics and public policy; health services and outcomes research; liver transplantation/hepatology; organ allocation; organ procurement and allocation.
© Copyright 2016 The American Society of Transplantation and the American Society of Transplant Surgeons.
Conflict of interest statement
The authors of this manuscript have no conflicts of interest to disclose as described by the American Journal of Transplantation.
Figures
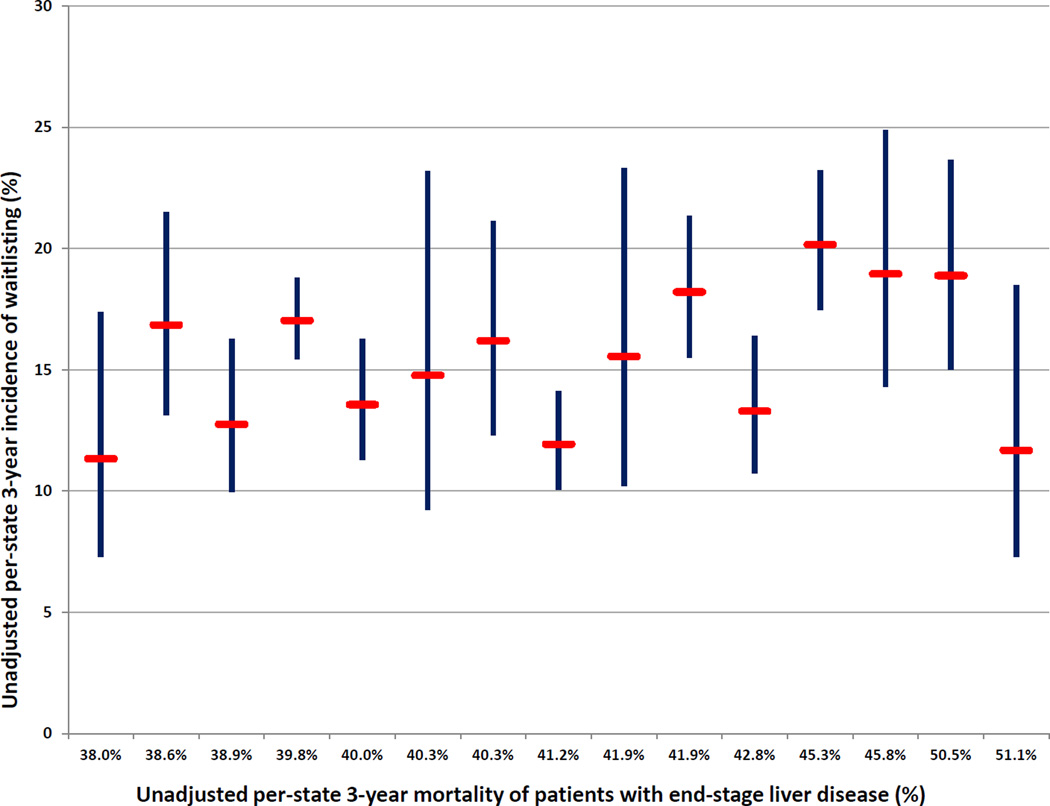
Figure Legend: *Red bars represent the estimated unadjusted 3-year incidence of waitlisting; blue bands represent 95% confidence intervals
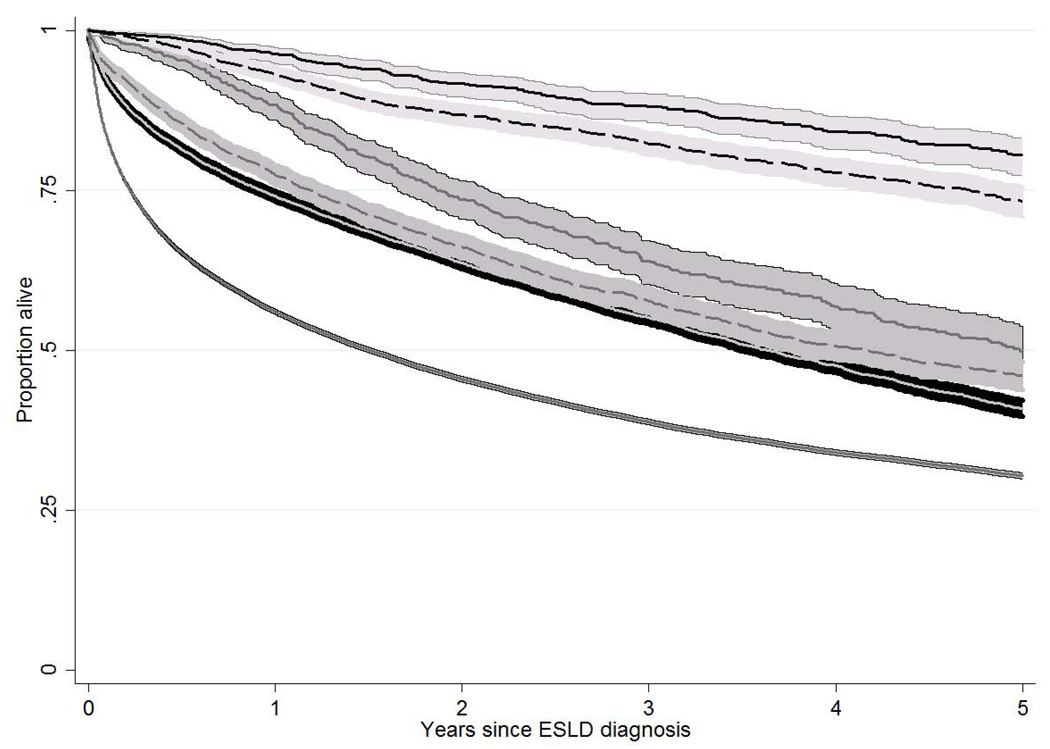
a: Unadjusted patient survival of patients with end-stage liver disease in HealthCore and Medicaid, stratified by waitlisting and transplant status
Figure legend
Risk table [Table: see text]
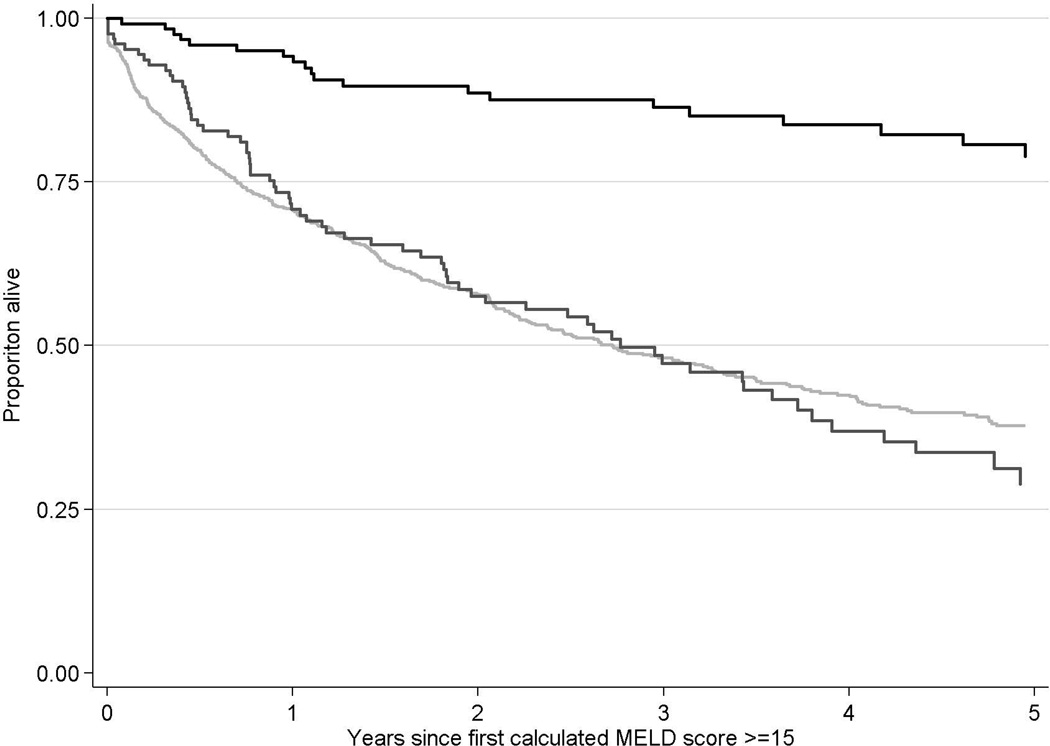
b: Unadjusted patient survival of patients with end-stage liver disease in HealthCore with a calculated MELD score ≥15
Figure legend
Risk table [Table: see text]
a: Unadjusted patient survival of patients with end-stage liver disease in HealthCore and Medicaid, stratified by waitlisting and transplant status
Figure legend
Risk table [Table: see text]
b: Unadjusted patient survival of patients with end-stage liver disease in HealthCore with a calculated MELD score ≥15
Figure legend
Risk table [Table: see text]
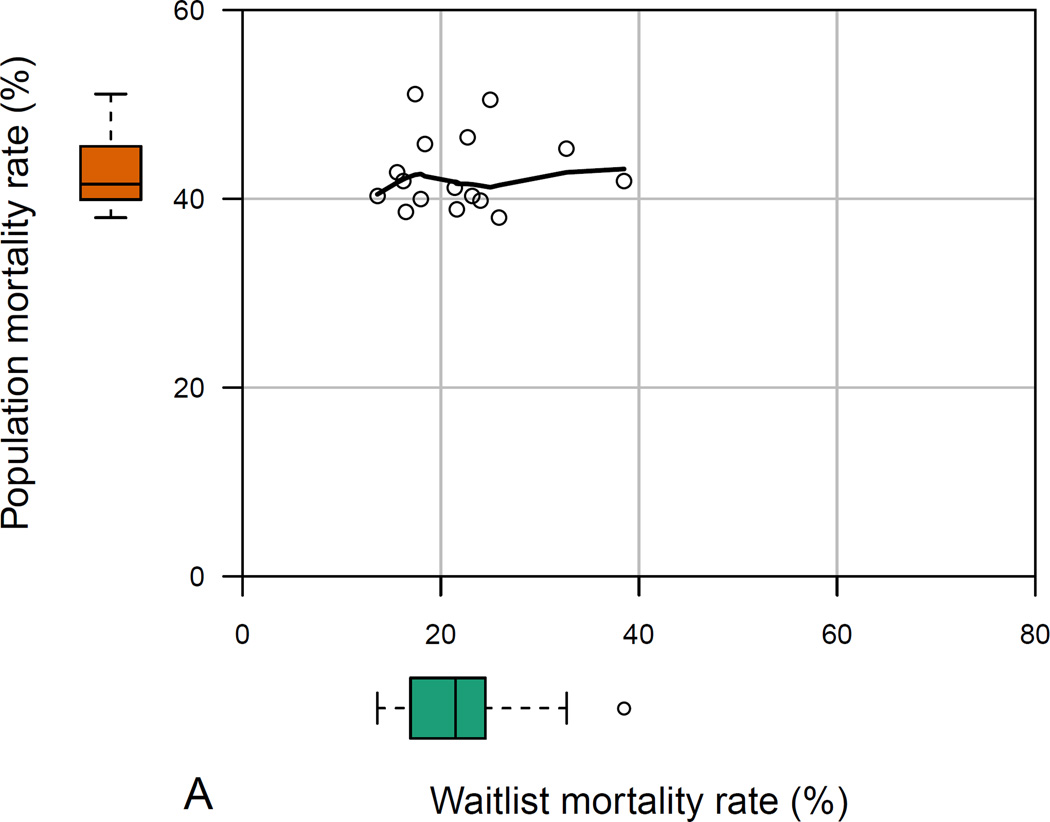
a: Among-state measures of waitlist- and population-level mortality in HealthCore patients with ESLD*
Footnote: * Data reported for the 16 states with ≥100 HealthCore patients with end-stage liver disease. The main plot demonstrates the correlation between waitlist- and population-level mortality rates, while the box-and-whisker plots demonstrate the absolute range in waitlist-and population-level mortality rates among the 16 sampled states.
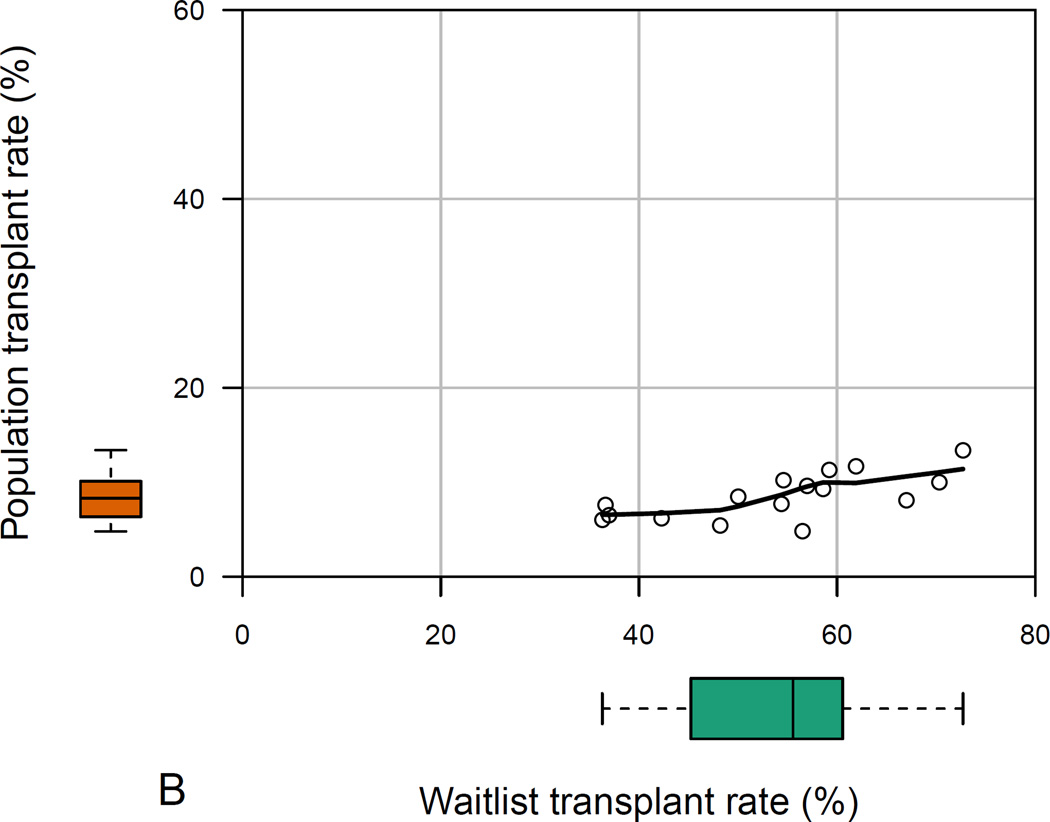
b: Among-state measures of waitlist- and population-level transplant rates in HealthCore patients with ESLD*
Footnote: * Data reported for the 16 states with ≥100 HealthCore patients with end-stage liver disease. The main plot demonstrates the correlation between waitlist- and population-level transplant rates, while the box-and-whisker plots demonstrate the absolute range in waitlist-and population-level transplant rates among the 16 sampled states.
a: Among-state measures of waitlist- and population-level mortality in HealthCore patients with ESLD*
Footnote: * Data reported for the 16 states with ≥100 HealthCore patients with end-stage liver disease. The main plot demonstrates the correlation between waitlist- and population-level mortality rates, while the box-and-whisker plots demonstrate the absolute range in waitlist-and population-level mortality rates among the 16 sampled states.
b: Among-state measures of waitlist- and population-level transplant rates in HealthCore patients with ESLD*
Footnote: * Data reported for the 16 states with ≥100 HealthCore patients with end-stage liver disease. The main plot demonstrates the correlation between waitlist- and population-level transplant rates, while the box-and-whisker plots demonstrate the absolute range in waitlist-and population-level transplant rates among the 16 sampled states.
Comment in
-
Improving Access to Liver Care Across the Continuum of Care: Opportunities and Challenges.Am J Transplant. 2016 Oct;16(10):2777-2778. doi: 10.1111/ajt.13903. Epub 2016 Jul 19. Am J Transplant. 2016. PMID: 27265241 No abstract available.
References
-
- Medical professionalism in the new millennium: a physician charter. Annals of internal medicine. 2002;136(3):243–246. - PubMed
-
- Halpern SD, Ubel PA, Caplan AL. Solid-organ transplantation in HIV-infected patients. The New England journal of medicine. 2002;347(4):284–287. - PubMed
-
- Ubel PA, Caplan AL. Geographic favoritism in liver transplantation--unfortunate or unfair? The New England journal of medicine. 1998;339(18):1322–1325. - PubMed
-
- Bajpayee M, Dhawan A, Parmar D, Pandey AK, Mathur N, Seth PK. Gender-related differences in basal DNA damage in lymphocytes of a healthy Indian population using the alkaline Comet assay. Mutat Res. 2002;520(1–2):83–91. - PubMed
Publication types
MeSH terms
Grants and funding
LinkOut - more resources
Full Text Sources
Other Literature Sources
Medical
