. 2016 Jul:173:74-91.e8.
doi: 10.1016/j.trsl.2016.03.008. Epub 2016 Mar 19.

Sickle cell disease biochip: a functional red blood cell adhesion assay for monitoring sickle cell disease

Affiliations

Sickle cell disease biochip: a functional red blood cell adhesion assay for monitoring sickle cell disease

Yunus Alapan et al. Transl Res. 2016 Jul.

Abstract

Sickle cell disease (SCD) afflicts millions of people worldwide and is associated with considerable morbidity and mortality. Chronic and acute vaso-occlusion are the clinical hallmarks of SCD and can result in pain crisis, widespread organ damage, and early movtality. Even though the molecular underpinnings of SCD were identified more than 60 years ago, there are no molecular or biophysical markers of disease severity that are feasibly measured in the clinic. Abnormal cellular adhesion to vascular endothelium is at the root of vaso-occlusion. However, cellular adhesion is not currently evaluated clinically. Here, we present a clinically applicable microfluidic device (SCD biochip) that allows serial quantitative evaluation of red blood cell (RBC) adhesion to endothelium-associated protein-immobilized microchannels, in a closed and preprocessing-free system. With the SCD biochip, we have analyzed blood samples from more than 100 subjects and have shown associations between the measured RBC adhesion to endothelium-associated proteins (fibronectin and laminin) and individual RBC characteristics, including hemoglobin content, fetal hemoglobin concentration, plasma lactate dehydrogenase level, and reticulocyte count. The SCD biochip is a functional adhesion assay, reflecting quantitative evaluation of RBC adhesion, which could be used at baseline, during crises, relative to various long-term complications, and before and after therapeutic interventions.


Figures

Fig 1
Fig 1
Sickle cell disease biochip (SCD biochip) probes red blood cell (RBC) adhesion in a closed system using minuscule amounts of whole blood samples. (A) Flow and RBC cell adhesion are illustrated inside the SCD biochip. Shown are varying levels of sickling and adherence to endothelium-associated protein-coated microchannel surfaces. (Inset) SCD biochip consists of multiple parallel microchannels. Scale bar represents a length of 10 mm. (B) Number of adhered RBCs are quantified inside microfluidic channels that are functionalized with FN or LN. We observed abnormal RBC adhesion in blood samples from SCD subjects. Adhered RBCs are marked with red dots. (C and D) High-resolution phase-contrast images of adhered RBCs with heterogeneous sickle morphologies inside the SCD biochip are shown. Different levels of RBC adhesion were observed in blood samples from patients with various clinical phenotypes, such as high or low hemoglobin F (HbF) levels. FN, Fibronectin; LN, laminin; RBC, red blood cell; SCD, sickle cell disease.
Fig 2
Fig 2
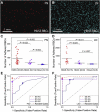
Adhesion of RBCs in FN- and LN-functionalized microchannels varies among SCD hemoglobin pheno-types and are greatest in HbSS. Shown are high resolution images of microchannels in (A) FN or (B) LN. The number of adhered RBCs was significantly higher in samples from subjects with HbSS > HbSC/Sβ+> HbAA in both (C) FN and (D) LN immobilized microchannels. The horizontal lines between individual groups represent a statistically significant difference based on a one-way ANOVA test (P < 0.05). Data point cross bars represent the mean. “N” represents the number of subjects. (E and F) Receiver operating-characteristic (ROC) curves display a true-positive rate (sensitivity) and a false-positive rate (1-specificity) for differentiation between SS-AA, SC-AA, and SS-SC hemoglobin phenotypes based on adhesion of RBCs to (E) FN and (F) LN. Defined thresholds for adhered RBC numbers on the ROC are as shown (◇ = 9 (SS-AA), □ = 9 (SC-AA), and ○ = 30 (SS-SC) for FN; ◇ = 16 (SS-AA), □ = 16 (SC-AA), and ○ = 170 (SS-SC) for LN). ANOVA, Analysis of variance; FN, fibronectin; LN, laminin; RBC, red blood cell; SCD, sickle cell disease.
Fig 3
Fig 3
Adhesion of RBCs is greater in HbSS subjects with a low (<%8) HbF, compared with high (>%8) HbF. (A and B) RBC adhesion was quantified in blood samples of HbSS patients with high and low HbF levels, from temporally nearest clinical measurement (not uniformly contemporaneous). Number of adhered RBCs was significantly higher in blood samples from subjects with low HbF levels compared with blood samples from subjects with high HbF levels in both (A) FN and (B) LN immobilized microchannels. The horizontal lines between individual groups represent a statistically significant difference based on a one-way ANOVA test (P < 0.05). Data point cross bars represent the mean. “N” represents the number of subjects. ANOVA, Analysis of variance; FN, fibronectin; HbF, fetal hemoglobin; LN, laminin; RBC, red blood cell.
Fig 4
Fig 4
RBC adhesion to FN is associated with lactate dehydrogenase (LDH) and HbS percentage. (A) Number of adhered RBCs in FN microchannels was significantly higher in blood samples with high LDH (>500 U/L). Seven of 9 samples are from subjects who had recently been transfused (Fig S4) and who had low LDH and low adhesion. (B) In blood samples with higher LDH and higher HbS (group 1), determined by k-means clustering analysis, (C) adherence to FN was significantly greater compared with lower LDH and lower HbS (group 2). Samples from recently transfused subjects are shown with triangle markers. The horizontal lines between individual groups represent a statistically significant difference based on a one-way ANOVA test (P < 0.05). Data point cross bars represent the mean. “N” represents the number of subjects. ANOVA, Analysis of variance; FN, fibronectin; RBC, red blood cell.
Fig 5
Fig 5
RBC adhesion to LN is associated with high LDH and high absolute reticulocyte counts. (A and B) RBCs in blood samples with (A) high LDH (>500 U/L) and (B) higher reticulocyte counts (>320 109/L) showed a significantly higher adherence to LN-immobilized microchannels compared with RBCs from samples with low LDH (<500 U/L) and low reticulocyte counts (<320 109/L), respectively. (C) Blood samples with higher LDH and higher reticulocyte counts (group 1), determined by k-means clustering analysis, (D) showed significantly greater adhesion to LN compared with blood samples with lower LDH and lower reticulocyte counts (group 2). The horizontal lines between individual groups represent a statistically significant difference based on a one-way ANOVA test (P < 0.05). Data point cross bars represent the mean. “N” represents the number of subjects. ANOVA, Analysis of variance; LDH, lactate dehydrogenase; LN, laminin; RBC, red blood cell.
Fig 6
Fig 6
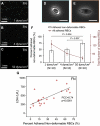
Heterogeneity in adhered RBCs in FN-functionalized microchannels is associated with serum LDH levels. (AC) Number and morphology of adhered RBCs were analyzed in HbSS blood samples at step-wise increased flow shear stresses; (A) 1 dyne/cm2, (B) 4 dyne/cm2, and (C) 50 dyne/cm2. (D) Deformable and (E) nondeformable RBCs were determined morphologically. Scale bars represent a length of 5 μm. (F) Nondeformable RBCs (% of total adhered RBCs) at 1, 4, and 50 dyne/cm2 flow shear stress were calculated (columns). Total number of RBCs at each flow velocity is shown. The horizontal lines between individual groups represent a statistically significant difference based on a one-way ANOVA test (P < 0.05). Error bars represent the standard error of the mean. “N” represents the number of subjects. (G) Shown is adhered nondeformable RBCs (% of total) and serum LDH (U/L) at 1 dyne/cm2 (Pearson correlation coefficient of 0.74, P < 0.0001, N = 21). ANOVA, Analysis of variance; FN, fibronectin; LDH, lactate dehydrogenase; RBC, red blood cell.

References

    1. Sprague RS, Stephenson AH, Ellsworth ML. Red not dead: signaling in and from erythrocytes. Trends Endocrinol Metab. 2007;18:350–5. - PubMed
    1. Mohandas N, Gallagher PG. Red cell membrane: past, present, and future. Blood. 2008;112:3939–48. - PMC - PubMed
    1. Meredith JE, Fazeli B, Schwartz MA. The extracellular-matrix as a cell-survival factor. Mol Biol Cell. 1993;4:953–61. - PMC - PubMed
    1. Skalak R, Branemar PI. Deformation of red blood cells in capillaries. Science. 1969;164:717–9. - PubMed
    1. Canham PB, Burton AC. Distribution of size and shape in populations of normal human red cells. Circ Res. 1968;22:405–22. - PubMed

Publication types

MeSH terms