

The Association Between Income and Life Expectancy in the United States, 2001-2014
- PMID: 27063997
- PMCID: PMC4866586
- DOI: 10.1001/jama.2016.4226
The Association Between Income and Life Expectancy in the United States, 2001-2014
Erratum in
-
Missing Negative Symbol.JAMA. 2017 Jan 3;317(1):90. doi: 10.1001/jama.2016.18691. JAMA. 2017. PMID: 28030679 No abstract available.
Abstract
Importance: The relationship between income and life expectancy is well established but remains poorly understood.
Objectives: To measure the level, time trend, and geographic variability in the association between income and life expectancy and to identify factors related to small area variation.
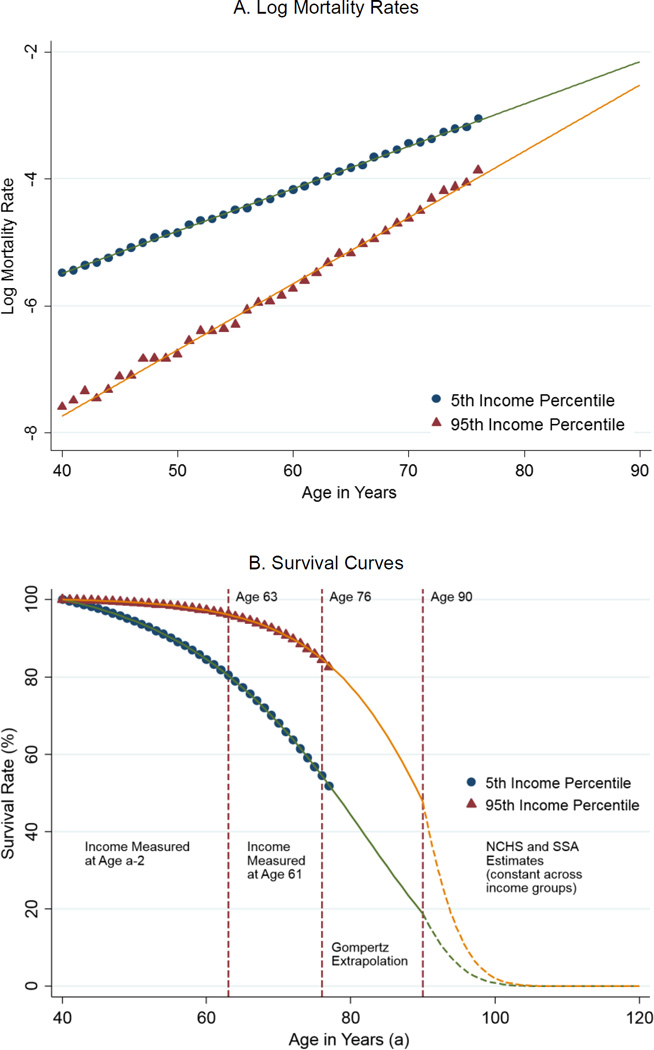
Design and setting: Income data for the US population were obtained from 1.4 billion deidentified tax records between 1999 and 2014. Mortality data were obtained from Social Security Administration death records. These data were used to estimate race- and ethnicity-adjusted life expectancy at 40 years of age by household income percentile, sex, and geographic area, and to evaluate factors associated with differences in life expectancy.
Exposure: Pretax household earnings as a measure of income.
Main outcomes and measures: Relationship between income and life expectancy; trends in life expectancy by income group; geographic variation in life expectancy levels and trends by income group; and factors associated with differences in life expectancy across areas.
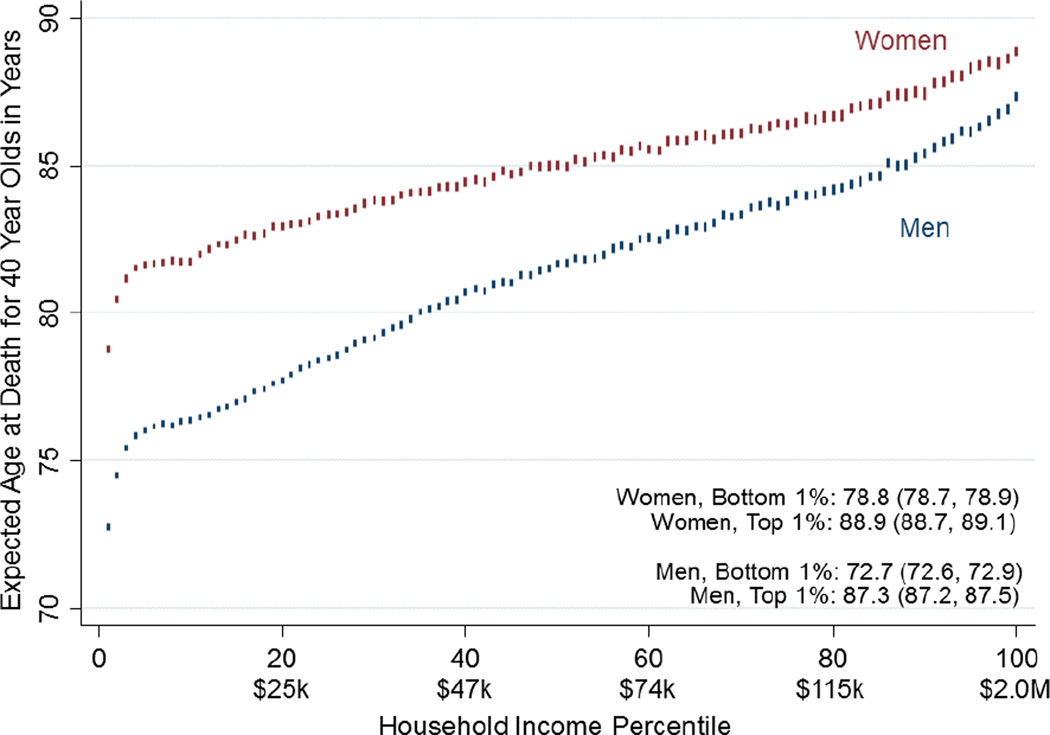
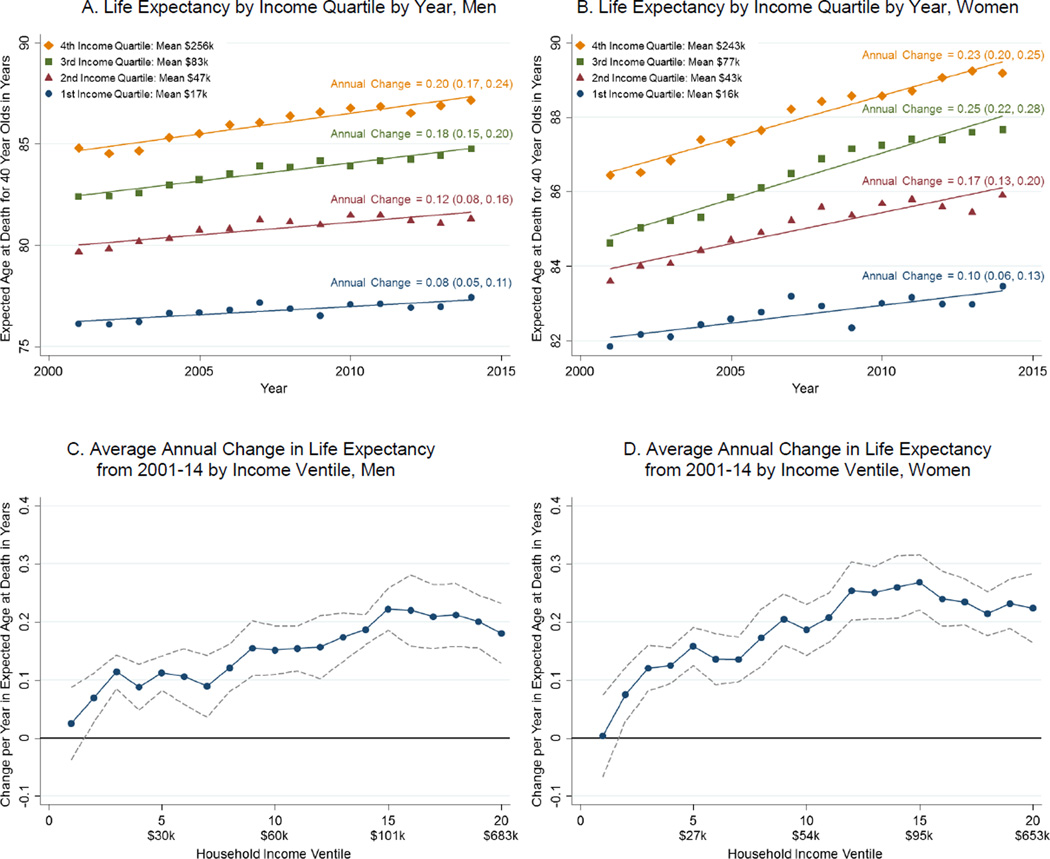
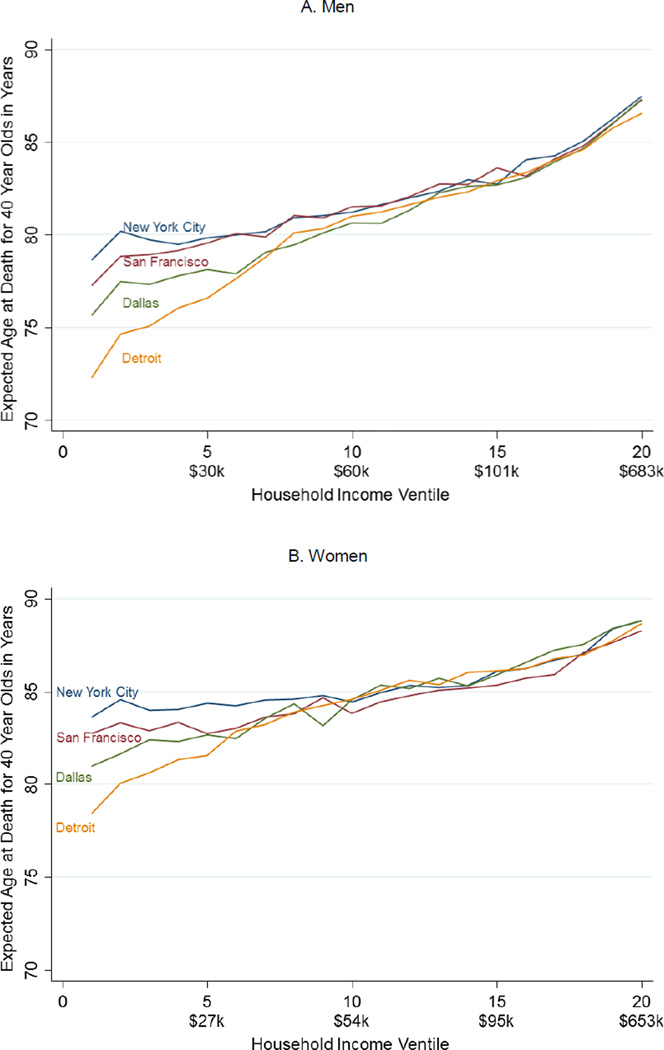
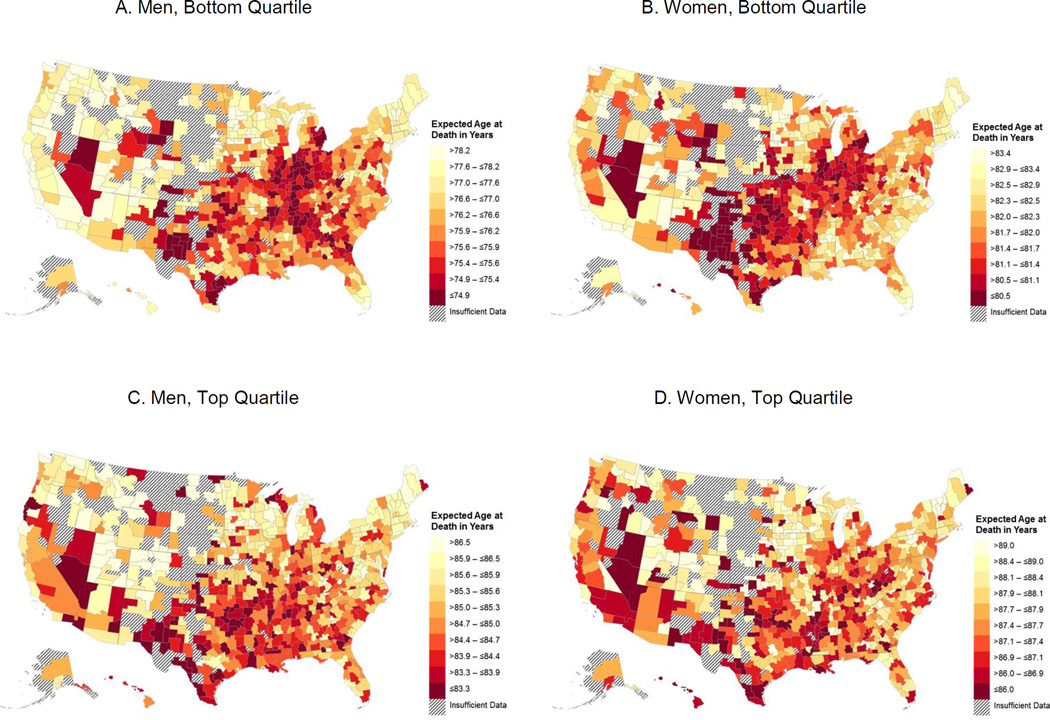
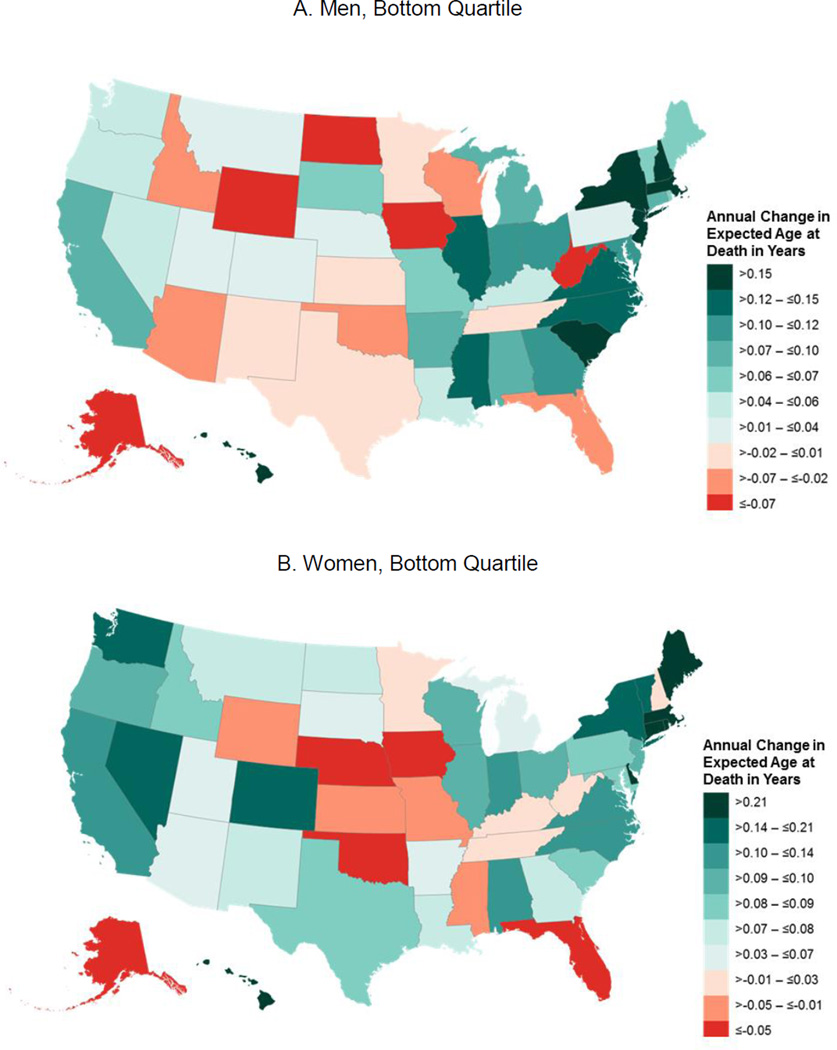
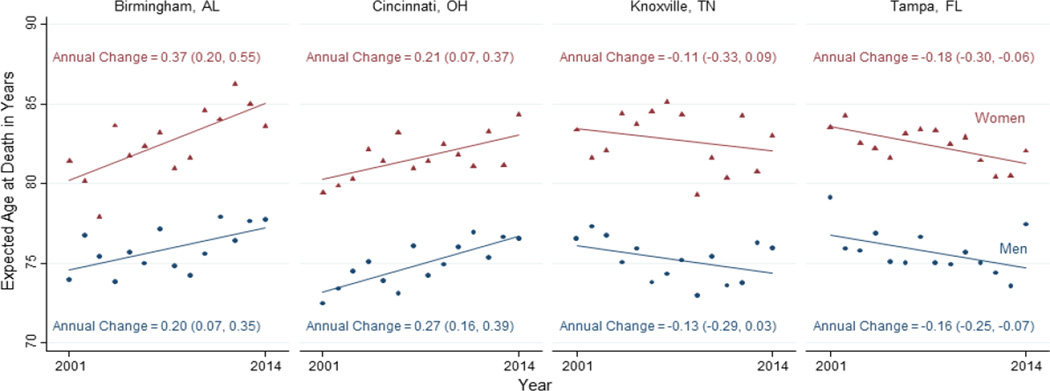
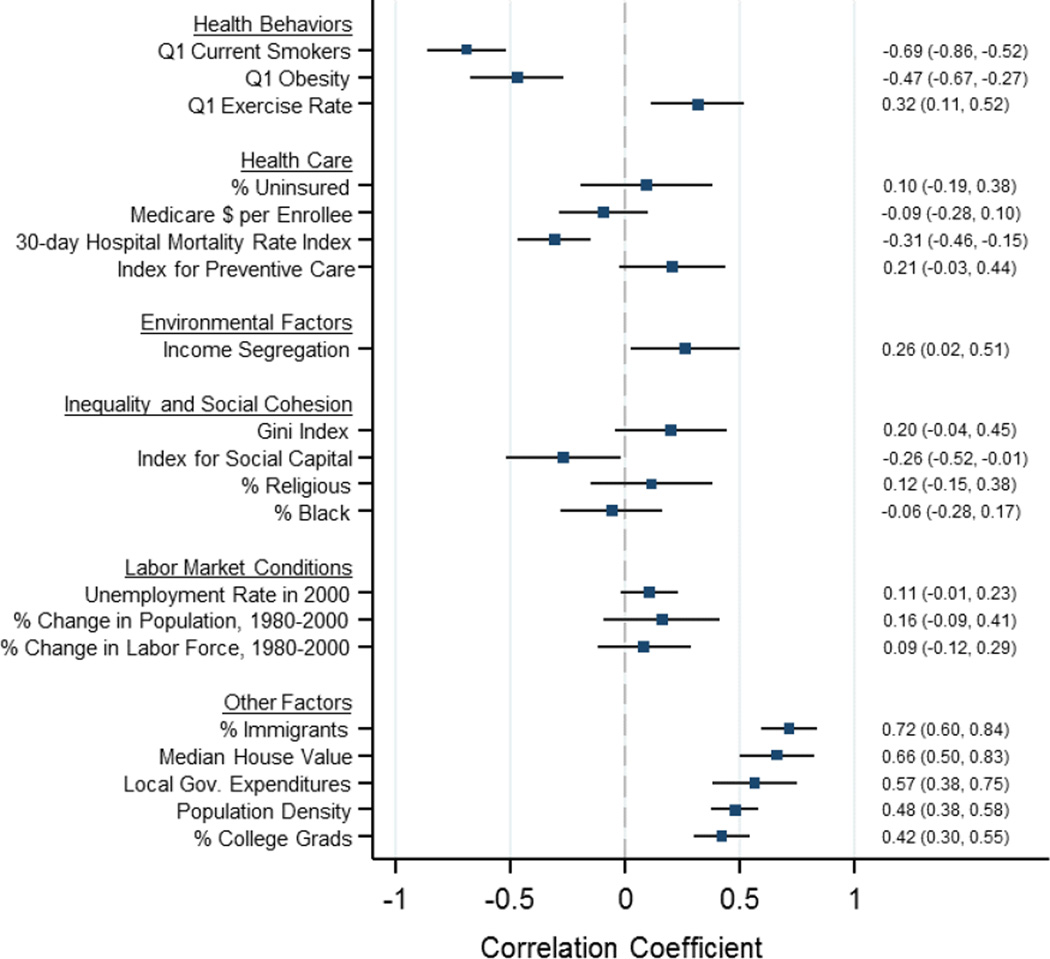
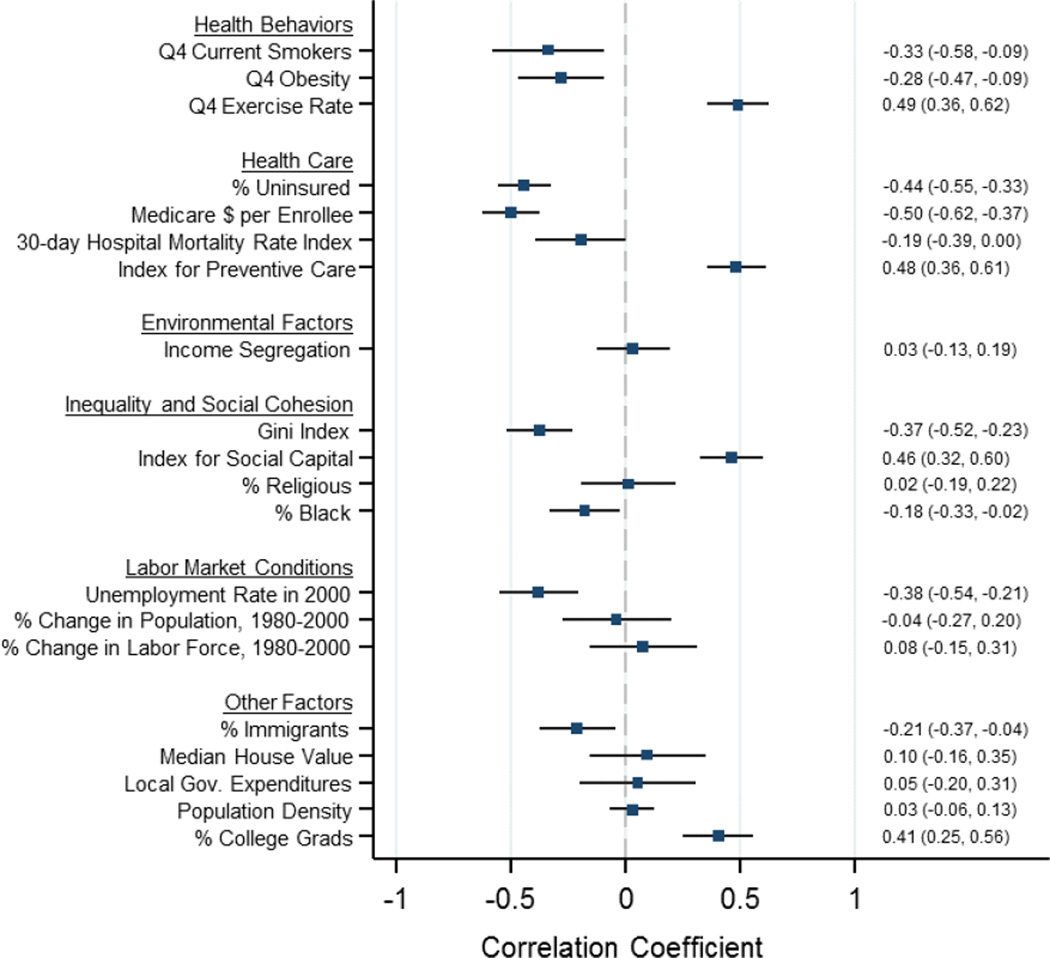
Results: The sample consisted of 1,408,287,218 person-year observations for individuals aged 40 to 76 years (mean age, 53.0 years; median household earnings among working individuals, $61,175 per year). There were 4,114,380 deaths among men (mortality rate, 596.3 per 100,000) and 2,694,808 deaths among women (mortality rate, 375.1 per 100,000). The analysis yielded 4 results. First, higher income was associated with greater longevity throughout the income distribution. The gap in life expectancy between the richest 1% and poorest 1% of individuals was 14.6 years (95% CI, 14.4 to 14.8 years) for men and 10.1 years (95% CI, 9.9 to 10.3 years) for women. Second, inequality in life expectancy increased over time. Between 2001 and 2014, life expectancy increased by 2.34 years for men and 2.91 years for women in the top 5% of the income distribution, but by only 0.32 years for men and 0.04 years for women in the bottom 5% (P < .001 for the differences for both sexes). Third, life expectancy for low-income individuals varied substantially across local areas. In the bottom income quartile, life expectancy differed by approximately 4.5 years between areas with the highest and lowest longevity. Changes in life expectancy between 2001 and 2014 ranged from gains of more than 4 years to losses of more than 2 years across areas. Fourth, geographic differences in life expectancy for individuals in the lowest income quartile were significantly correlated with health behaviors such as smoking (r = -0.69, P < .001), but were not significantly correlated with access to medical care, physical environmental factors, income inequality, or labor market conditions. Life expectancy for low-income individuals was positively correlated with the local area fraction of immigrants (r = 0.72, P < .001), fraction of college graduates (r = 0.42, P < .001), and government expenditures (r = 0.57, P < .001).
Conclusions and relevance: In the United States between 2001 and 2014, higher income was associated with greater longevity, and differences in life expectancy across income groups increased over time. However, the association between life expectancy and income varied substantially across areas; differences in longevity across income groups decreased in some areas and increased in others. The differences in life expectancy were correlated with health behaviors and local area characteristics.
Conflict of interest statement
Figures
Comment in
-
On Death and Money: History, Facts, and Explanations.JAMA. 2016 Apr 26;315(16):1703-5. doi: 10.1001/jama.2016.4072. JAMA. 2016. PMID: 27063421 No abstract available.
-
The Good Life: Working Together to Promote Opportunity and Improve Population Health and Well-being.JAMA. 2016 Apr 26;315(16):1706-8. doi: 10.1001/jama.2016.4263. JAMA. 2016. PMID: 27063639 No abstract available.
-
Income, Life Expectancy, and Community Health: Underscoring the Opportunity.JAMA. 2016 Apr 26;315(16):1709-10. doi: 10.1001/jama.2016.4729. JAMA. 2016. PMID: 27063840 No abstract available.
-
Relationships Between Income, Health Behaviors, and Life Expectancy.JAMA. 2016 Aug 23-30;316(8):880. doi: 10.1001/jama.2016.9376. JAMA. 2016. PMID: 27552625 No abstract available.
-
Relationships Between Income, Health Behaviors, and Life Expectancy--Reply.JAMA. 2016 Aug 23-30;316(8):880-1. doi: 10.1001/jama.2016.9379. JAMA. 2016. PMID: 27552626 No abstract available.
-
Kidney Disease, Income, and Life Expectancy.Am J Kidney Dis. 2016 Nov;68(5):674-676. doi: 10.1053/j.ajkd.2016.07.004. Am J Kidney Dis. 2016. PMID: 27772630 No abstract available.
References
-
- Kitagawa E, Hauser P. Differential Mortality in the United States: A Study in Socioeconomic Epidemiology. Cambridge, MA: Harvard University Press; 1973.
-
- Marmot M. Social determinants of health inequalities. Lancet. 2005;365(9464):1099–1104. Medline:15781105. - PubMed
-
- Cutler D, Deaton A, Lleras-Muney A. The determinants of mortality. J Econ Perspect. 2006;20:97–120.
-
- Mackenbach JP, Stirbu I, Roskam AJ, et al. European Union Working Group on Socioeconomic Inequalities in Health. Socioeconomic inequalities in health in 22 European countries. N Engl J Med. 2008;358(23):2468–2481. Medline:18525043. - PubMed
-
- Berkman L, Kawachi I, Glymour M. Social Epidemiology. 2nd. Oxford, England: Oxford University Press; 2014.
Publication types
MeSH terms
Grants and funding
LinkOut - more resources
Full Text Sources
Other Literature Sources
Medical
Miscellaneous
