. 2016 May 2;126(5):1815-33.
doi: 10.1172/JCI82409. Epub 2016 Apr 11.

Amyloid precursor protein-mediated endocytic pathway disruption induces axonal dysfunction and neurodegeneration

Amyloid precursor protein-mediated endocytic pathway disruption induces axonal dysfunction and neurodegeneration

Wei Xu et al. J Clin Invest. .

Abstract

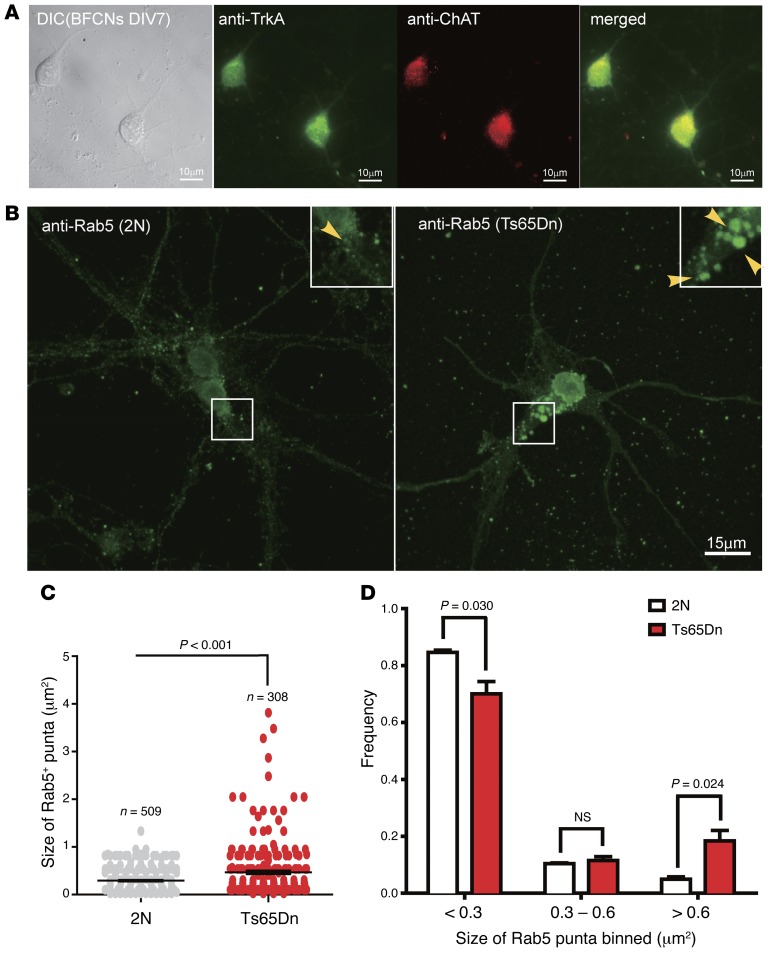
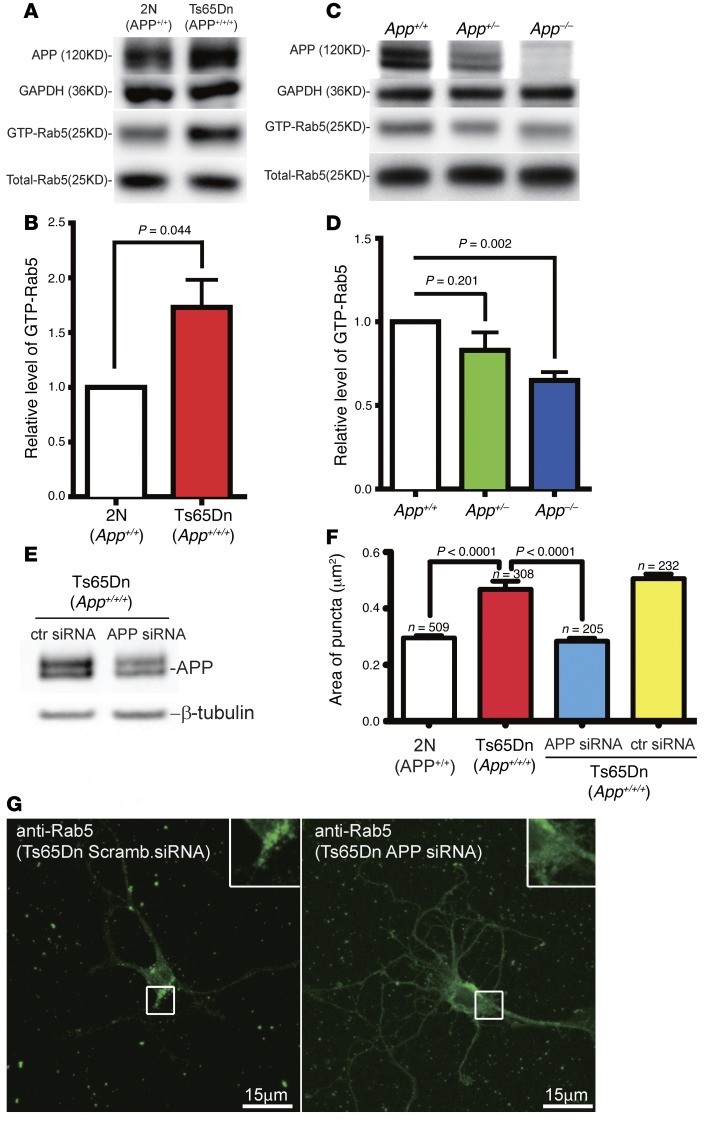
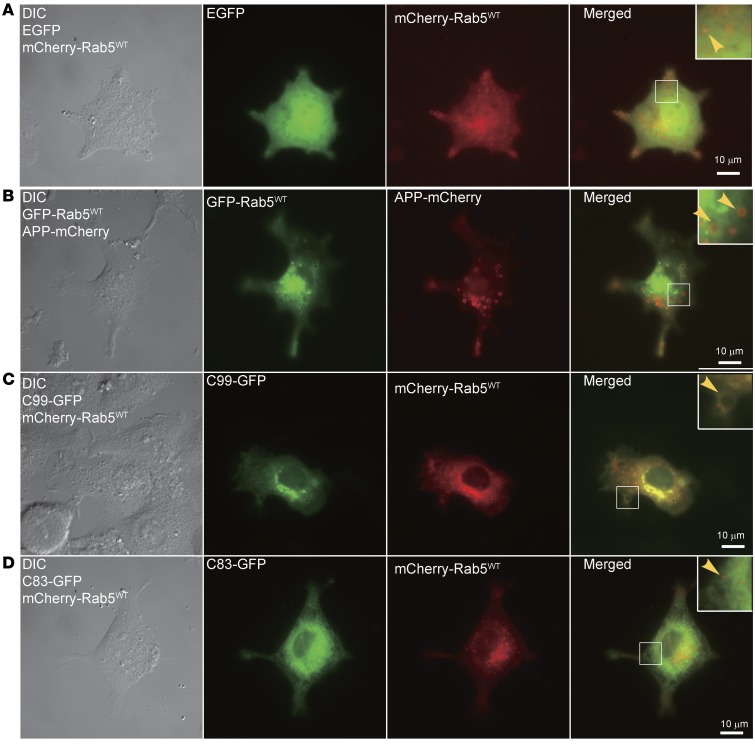
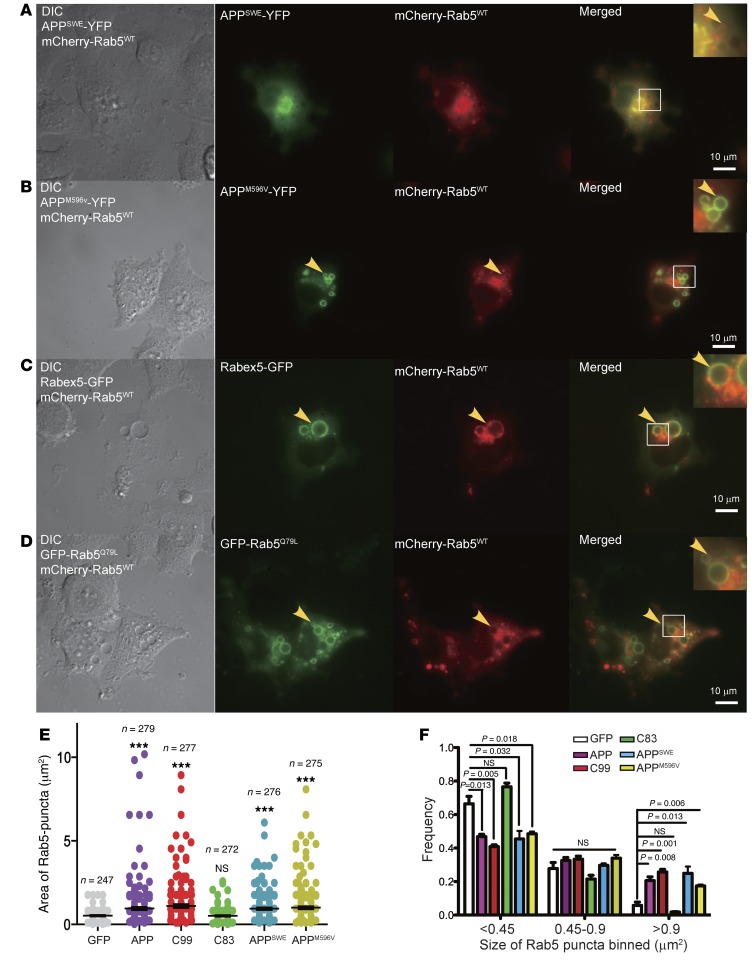
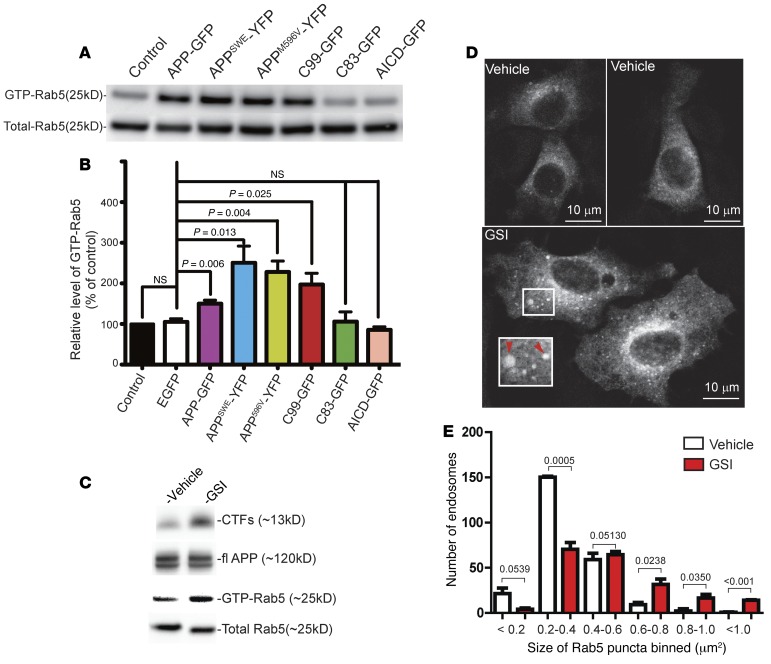
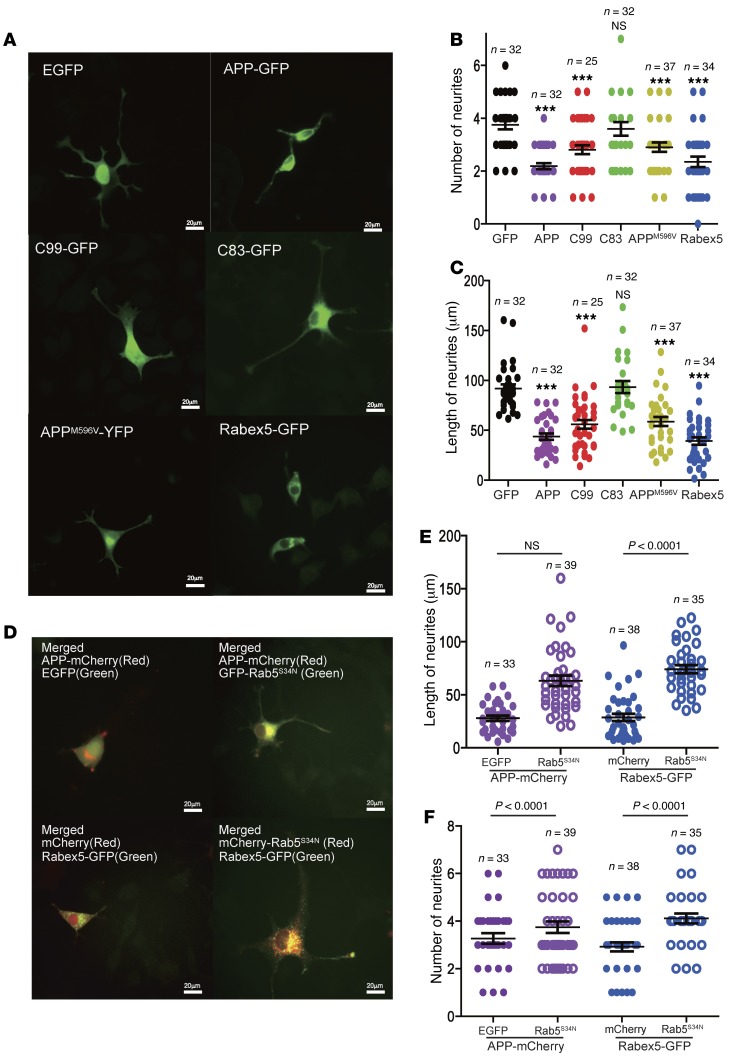
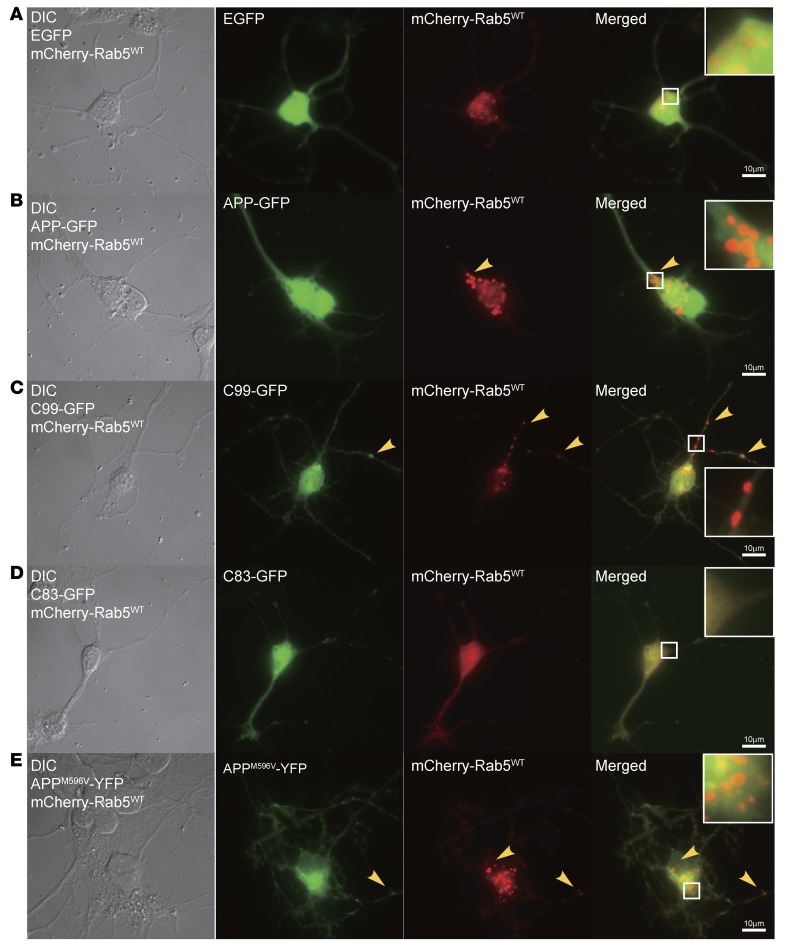
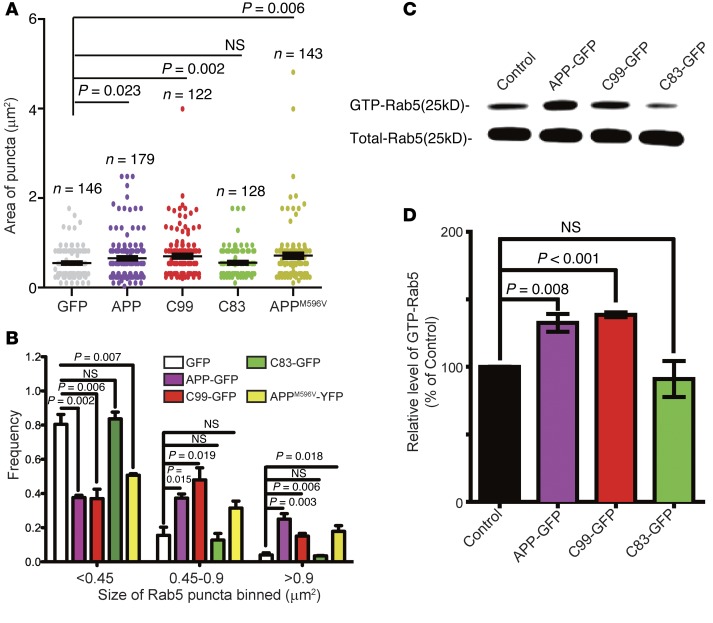
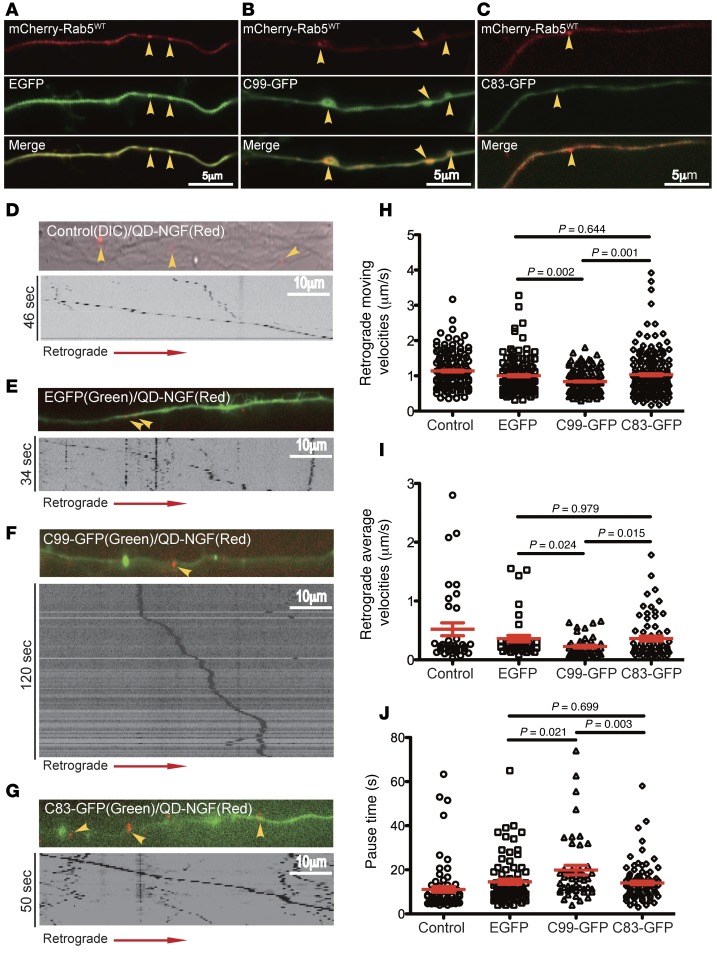
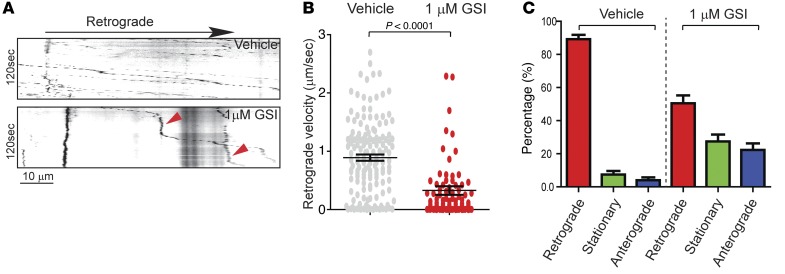
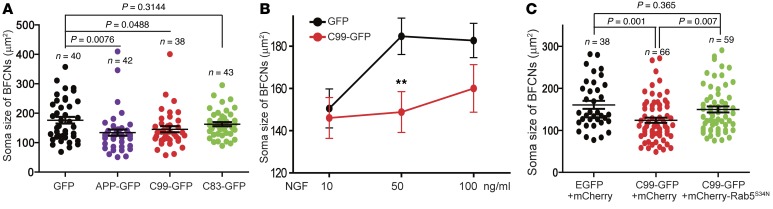
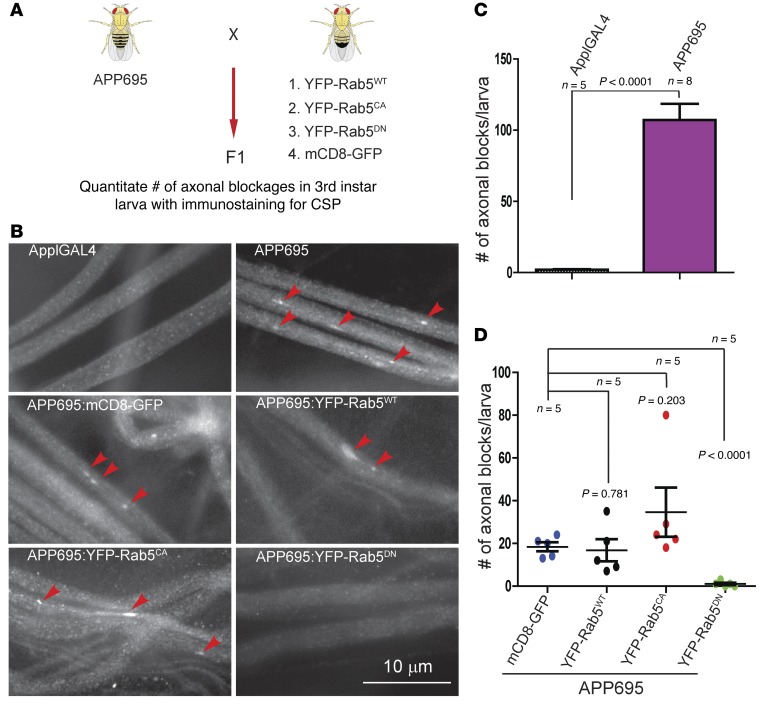
The endosome/lysosome pathway is disrupted early in the course of both Alzheimer's disease (AD) and Down syndrome (DS); however, it is not clear how dysfunction in this pathway influences the development of these diseases. Herein, we explored the cellular and molecular mechanisms by which endosomal dysfunction contributes to the pathogenesis of AD and DS. We determined that full-length amyloid precursor protein (APP) and its β-C-terminal fragment (β-CTF) act though increased activation of Rab5 to cause enlargement of early endosomes and to disrupt retrograde axonal trafficking of nerve growth factor (NGF) signals. The functional impacts of APP and its various products were investigated in PC12 cells, cultured rat basal forebrain cholinergic neurons (BFCNs), and BFCNs from a mouse model of DS. We found that the full-length wild-type APP (APPWT) and β-CTF both induced endosomal enlargement and disrupted NGF signaling and axonal trafficking. β-CTF alone induced atrophy of BFCNs that was rescued by the dominant-negative Rab5 mutant, Rab5S34N. Moreover, expression of a dominant-negative Rab5 construct markedly reduced APP-induced axonal blockage in Drosophila. Therefore, increased APP and/or β-CTF impact the endocytic pathway to disrupt NGF trafficking and signaling, resulting in trophic deficits in BFCNs. Our data strongly support the emerging concept that dysregulation of Rab5 activity contributes importantly to early pathogenesis of AD and DS.


Figures

Figure 1
Figure 1. Rab5+ early endosomes were enlarged in primary BFCNs of Ts65Dn mice.
(A) Representative images of primary BFCNs (DIV7) were costained for the cholinergic neuronal marker ChAT (red) and the NGF receptor TrkA (green). DIC and merged images are also shown. Scale bars: 10 μm. (B) Representative images are shown for Rab5 staining of BFCNs from Ts65Dn (right) and 2N littermates (left). The sizes of Rab5+ puncta in BFCNs from Ts65Dn and 2N littermates were quantified using ImageJ. Insets: Zoom-in (×2) images of selected areas. Scale bar: 15 μm. (C) Measurement of Rab5+ puncta in B. The average area was 0.468 μm2 (n = 308) for Ts65Dn, 0.295 μm2 (n = 509) for 2N. The measurements were from 3 experiments, with 20–30 cells analyzed each time. (D) The size distribution of Rab5+ puncta in BFCNs from Ts65Dn mice showed a shift from smaller to larger binned areas in comparison to those from 2N littermates. All data represent mean ± SEM (n = 3), and P values were calculated using Student’s t test. n.s., nonsignificant.
Figure 2
Figure 2. The level of GTP-Rab5 correlated with App gene dose in mouse brain tissues.
(A) Protein levels of APP, GAPDH, GTP-Rab5, and total Rab5 in brain homogenates from 12-month-old Ts65Dn and 2N littermates were assayed as described in Methods. (B) The levels of GTP-Rab5 in these samples were quantitated and normalized against internal control, showing a 73% increase in 12-month-old Ts65Dn samples relative to 2N littermates. The level of GTP-Rab5 in 2N littermates was set at 1. (C) The protein level of APP in the brain homogenates from E17 App+/+, App+/–, and App–/– embryos was detected using an antibody against the C-terminus of APP (top lane). The level of GTP-Rab5 in App+/+ mouse brains was set at 1, with the relative levels shown in D. (E) APP levels were detected in BFCNs of Ts65Dn mice that were treated with control or APP siRNA; β-tubulin was used as a loading control. (F) The size of Rab5+ puncta was significantly reduced by APP siRNA, compared with control siRNA (ctr siRNA). (G) Representative images showing Rab5 staining of BFCNs from Ts65Dn mice with APP knockdown (right) and control siRNA (Scramb., scrambled; left). Insets: Zoom-in (×2.5) images of the selected areas. Scale bars: 15 μm. All data represent mean ± SEM of >3 independent experiments, and P values were calculated using Student’s t test.
Figure 3
Figure 3. Full-length APP and C99, but not C83, induced the enlargement of Rab5+ endosomes in PC12M cells.
PC12M cells were cultured on glass coverslips and cotransfected with the indicated plasmids. Live cell imaging was performed as described in Methods. Images of DIC, FITC, and Texas Red channels were collected, and representative images are shown. Images for cotransfection of mCherry-Rab5WT with EGFP served as the control (A). (B) Cotransfection of EGFP-Rab5WT with APP-mCherry. Cotransfection of mCherry-Rab5WT with (C) C99-GFP or (D) C83-GFP. Insets: Zoom-in (×2.5) images of the selected areas. Scale bars: 10 μm.
Figure 4
Figure 4. APPSWE and APPM596V induced the enlargement of Rab5+ endosomes in PC12M cells.
As in Figure 3, mCherry-Rab5WT was cotransfected into PC12M cells with APPSWE-YFP (A), APPM596V-YFP (B), Rabex-5–GFP (C), or GFP-Rab5Q79L (D). Scale bars: 10 μm. Rab5+ endosomes are indicated by arrowheads. Insets: Zoom-in (×2.5) images of the selected areas. The size of Rab5+ endosomes for each APP constructs was quantified using ImageJ, and the results are shown in E (***P < 0.001), with the size distribution of Rab5+ endosomes shown in F. All P values were calculated using Student’s t test.
Figure 5
Figure 5. APP, APP mutants, or C99 induced hyperactivation of Rab5 in PC12M cells.
PC12M cells were cultured and transfected with the indicated constructs. The levels of GTP-Rab5 were assayed as in Figure 2. The levels of total Rab5 were blotted as loading controls (A). The results were quantitated and are presented in B. The level of GTP-Rab5 in untransfected cells was set at 100%. (C) PC12M cells were treated with either vehicle or 1 μM GSI for 24 hours, and cell lysates were analyzed by SDS-PAGE/immunoblotting with the indicated antibodies. Both full-length APP (fl APP) and APP CTFs are shown. The levels of activated Rab5 and total Rab5 are also shown. (D) PC12M cells were transfected with mCherry-Rab5WT for 24 hours and were treated with either 1 μM GSI or vehicle for another 48 hours. Cells were fixed and analyzed by use of a Leica TCS SPE confocal microscope with a ×63 oil objective lens. Representative images of mCherry-Rab5WT puncta are shown. Enlarged mCherry-Rab5WT puncta by GSI treatment are highlighted in the inset (×1.6; arrowheads). Scale bars: 10 μm. The sizes of mCherry-Rab5WT puncta from 25–30 transfected cells were quantitated, and the size distribution pattern is shown in E. Data represent mean ± SEM of at least 3 independent experiments. All corresponding P values were calculated using Student’s t test.
Figure 6
Figure 6. APP, APP mutants, or C99 inhibited NGF-induced neurite outgrowth that was rescued by Rab5S34N.
PC12M cells were transfected with the indicated plasmids and treated with 50 ng/ml NGF for 48 hours. The length and the number of neurites of each cell were measured and quantitated using ImageJ. Representative images are shown in A. The number of the neurites/cell (B) and the average length (C) in each condition are measured, and the results are shown. (DF) Rab5S34N-GFP or Rab5S34N-mCherry was cotransfected with APP-mCherry or Rabex-5–GFP into PC12M cells (D). Cells were then induced for differentiation. The number of the neurites/cell (E) and the average length (F) of each condition were measured, and the results are shown. All P values were calculated using Student’s t test; ***P < 0.001. Scale bars: 20 μm.
Figure 7
Figure 7. APP, APPM596V, or C99 induced the enlargement of Rab5+ endosomes in BFCNs.
Primary rat E18 BFCNs were cultured on poly-l-lysine–coated glass coverslips. Neurons (DIV6) were transfected with the indicated plasmids for 24–48 hours. Live imaging was performed as described in Methods. Images of DIC, red, and green channels were captured. Representative images of BFCNs are shown for cotransfection: mCherry-Rab5WT/EGFP (A), mCherry-Rab5WT/APP-GFP (B), mCherry-Rab5WT/C99-GFP (C), mCherry-Rab5WT/C83-GFP (D), mCherry-Rab5WT/APPM596V-YFP (E). Arrowheads indicate Rab5+ endosomes. Overexpression of APP-GFP, APPM596V-YFP, and C99-GFP induced enlarged Rab5+ endosomes. Scale bars: 10 μm; magnification (insets), ×3.5.
Figure 8
Figure 8. APP and C99 increased the level of GTP-Rab5 in BFCNs.
(A) The size of Rab5+ endosomes in primary BFCNs from experiments in Figure 7 was quantified using ImageJ. The endosomal size distribution for APP-GFP, APPM596V-YFP, and C99-GFP showed a shift in sizes from smaller to larger binned areas as compared with that for EGFP and C83-GFP (B). Data represent the mean value of three independent experiments. (C and D) The levels of GTP-Rab5 and total Rab5 were also measured in BFCNs that expressed these various constructs. The level of GTP-Rab5 in untransfected cells was set at 100% (D). Data represent mean ± SEM of at least 3 independent experiments. All P values were calculated using Student’s t test.
Figure 9
Figure 9. C99 inhibited retrograde axonal transport of NGF in BFCNs.
(A) Rat E18 BFCNs were cultured in microfluidic chambers and were cotransfected with the indicated expression vectors. Live imaging was performed as described in Methods. Representative images of axons of BFCNs are shown for mCherry-Rab5WT/EGFP (A), mCherry-Rab5/C99-GFP (B), and mCherry-Rab5/C83-GFP (C) Arrowheads indicate the enlarged Rab5+ structures that colocalized with C99-GFP. Scale bars: 5 μm. (DG) Representative images and kymographs of axonal transport of QD-NGF signals. Scale bars: 10 μm. Retrograde movement (H), average velocities (I), and pause time (J) of the QD-NGF signals in axons were quantitated. Significantly slowed retrograde transport and longer pause time are seen for C99-GFP–transfected axons as compared with untransfected control or with C83-GFP–transfected axons (CE). Data represent mean ± SEM of at least 3 independent experiments. All P values were calculated using 1-way ANOVA.
Figure 10
Figure 10. GSI induced hyperactivation of Rab5 and inhibited retrograde axonal transport of NGF in BFCNs.
Rat E18 BFCNs (DIV6) were cultured in microfluidic chambers, and both the cell body and the distal axonal chamber were treated with either vehicle or 1 μM GSI for 2 hours. Live imaging of QD-NGF was performed as described in Methods. (A) Representative kymographs derived from time-lapse image series of axonal transport of QD-NGF from vehicle- and GSI-treated samples. (B) Retrograde moving speed and (C) breakdowns of transport directionalities (retrograde, stationary, and anterograde) for vehicle- and GSI-treated samples. Data represent mean ± SEM of at least 3 independent experiments. The P value was calculated using Student’s t test.
Figure 11
Figure 11. C99 induced-atrophy of BFCNs was rescued by Rab5S34N.
Rat E18 BFCNs were cultured in microfluidic chambers as described in Methods. (A) Neurons were transfected with the indicated plasmids for 48 hours, and the soma profiles of BFCNs were measured and quantified using ImageJ. (B) BFCNs were transfected with EGFP or C99 and were maintained in medium containing 10, 50, or 100 ng/ml NGF for 48 hours; soma sizes of BFCNs were measured as in A. (C) BFCNs were transfected with the indicated plasmids for 48 hours; the soma profiles of BFCNs were measured as in A and B. All P values were calculated using Student’s t test.
Figure 12
Figure 12. Expression of dominant-negative Rab5 suppressed APP-mediated axonal blockages in Drosophila larval segmental nerves.
(A) Schematic of APP strain with stains that express different Rab5 constructs as well as mCD8 as the control. (B) Axonal blocks (arrowheads) in representative images of Drosophila third instar larval segmental nerves, immunostained with the synaptic vesicle marker cysteine string protein (CSP). Control (ApplGAL4) larvae show smooth CSP staining in larval segmental nerves, indicating no axonal transport defects (top left). Expression of human APP695 causes a severe axonal blockage phenotype (top right). The average number of axonal blocks/larva is shown in C. Coexpression of human APP695 with membrane-bound mCD8-GFP also shows axonal blockages in larval segmental nerves (B, middle left, arrowheads), which was used as a control for the effect of protein overexpression on axonal blockages. Representative images for larval segmental nerves resulted from the cross between human APP695 with wild-type YFP-Rab5WT (middle right), constitutively active YFP-Rab5CA (bottom left), or dominant-negative YFP-Rab5DN (bottom right). Axonal blockages (arrowheads) were quantitated within the entire larvae for each genotype, and the average number of axonal blocks for each genotype is shown in D. Expression of YFP-Rab5DN with APP695 significantly reduced the amount of axonal blocks as compared with larvae expressing human APP695 with mCD8-GFP (P < 0.0001, Student’s t test). Data represent mean ± SEM. Scale bars: 10 μm.

References

    1. Selkoe DJ. The cell biology of β-amyloid precursor protein and presenilin in Alzheimer’s disease. Trends Cell Biol. 1998;8(11):447–453. doi: 10.1016/S0962-8924(98)01363-4. - DOI - PubMed
    1. Selkoe DJ. Toward a comprehensive theory for Alzheimer’s disease. Ann N Y Acad Sci. 2000;924:17–25. - PubMed
    1. Selkoe DJ. Alzheimer’s disease: genes, proteins, and therapy. Physiol Rev. 2001;81(2):741–766. - PubMed
    1. Holtzman DM, Mandelkow E, Selkoe DJ. Alzheimer disease in 2020. Cold Spring Harb Perspect Med. 2012;2(11): - PMC - PubMed
    1. Selkoe DJ. Alzheimer’s disease. Cold Spring Harb Perspect Biol. 2011;3(7): - PMC - PubMed

Publication types

MeSH terms

Substances