

doi: 10.1038/nmeth.3833.
Epub 2016 Apr 11.
Expansion microscopy with conventional antibodies and fluorescent proteins
Affiliations
- PMID: 27064647
- PMCID: PMC4929147
- DOI: 10.1038/nmeth.3833
Item in Clipboard
Expansion microscopy with conventional antibodies and fluorescent proteins
Nat Methods.
2016 Jun.
Abstract
Expansion microscopy is a technique in which fluorophores on fixed specimens are linked to a swellable polymer that is physically expanded to enable super-resolution microscopy with ordinary microscopes. We have developed and characterized new methods for linking fluorophores to the polymer that now enable expansion microscopy with conventional fluorescently labeled antibodies and fluorescent proteins. Our methods simplify the procedure and expand the palette of compatible labels, allowing rapid dissemination of the technique.
Figures
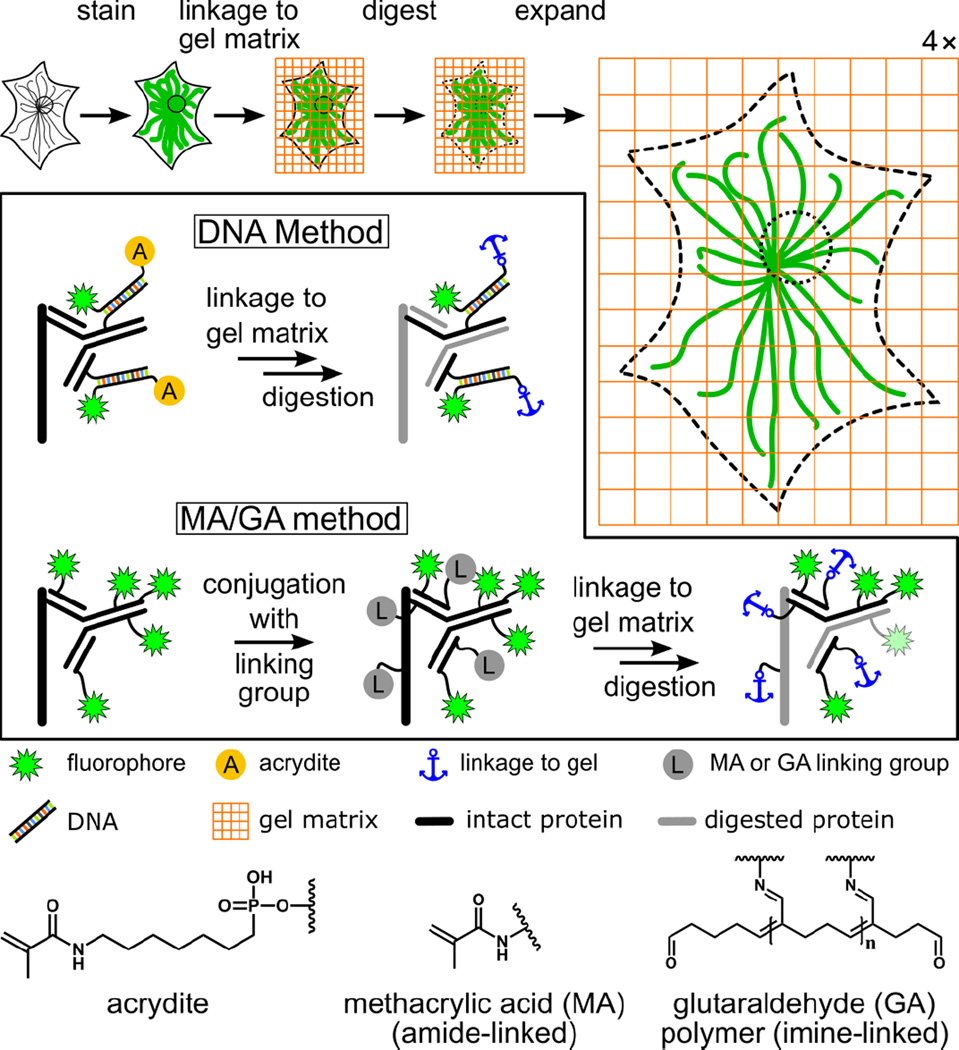
Schematic illustration of expansion microscopy and label retention strategies. The boxed region highlights the difference between the original DNA method and the post-stain linker-group functionalization method (“MA/GA method”) presented in this work. In the DNA method, the specimen is immunostained with a custom-prepared antibody bearing doubly-modified DNA linked to a fluorophore and an acrydite moiety (A). In contrast, with the MA/GA method, methacrylic acid N-hydroxy succinimidyl ester (MA-NHS) or glutaraldehyde (GA) are used to label the entire sample with polymer-linking groups after conventional immunostaining with fluorophore-labeled antibodies (only secondary antibodies are shown). For both methods, the next steps are gelation, digestion with a protease, and expansion through dialysis into deionized water. The acrydite (A), MA, and GA groups allow formation of a linkage to the hydrogel. Dyes are retained through a connection to antibody fragments that also contain a linkage to the gel. Fluorescent proteins are also retained using the MA/GA method through a similar method but are not shown here for the sake of clarity.
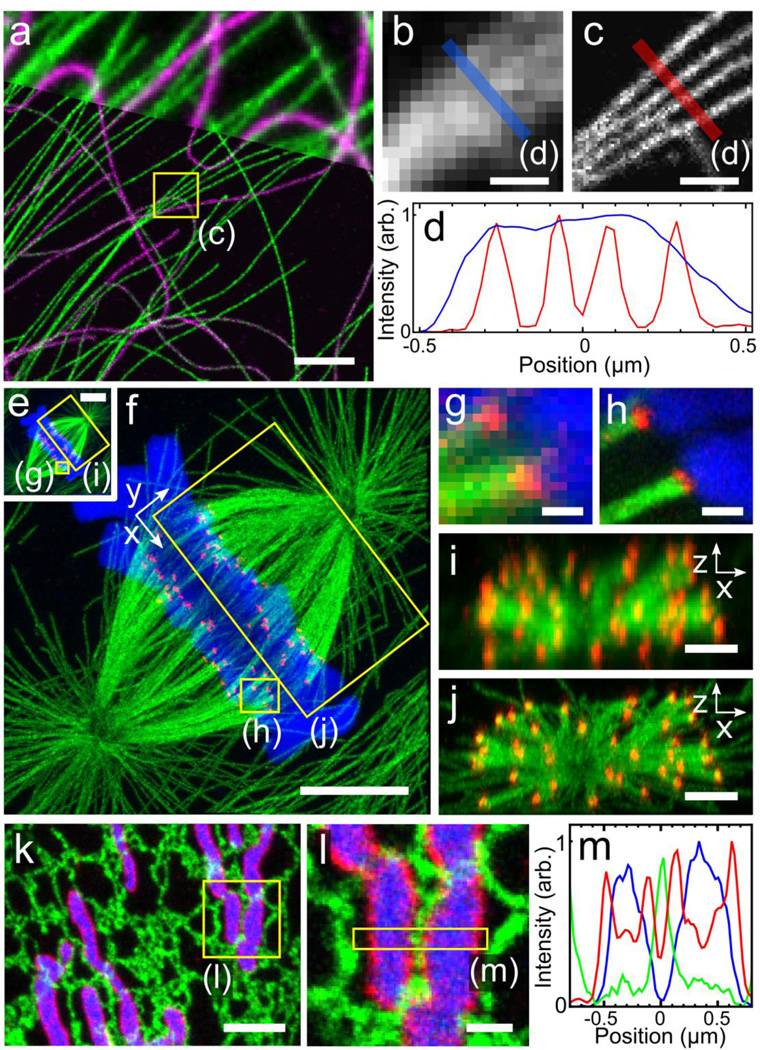
Confocal fluorescence images of expanded cultured cells. (a) BS-C-1 cell immunostained for tyrosinated tubulin (green) and detyrosinated tubulin (magenta) using conventional secondary antibodies and partially overlaid with corresponding pre-expansion image (top). Specimen was treated with MA-NHS after immunostain. Zoom-in of boxed region in a showing corresponding pre-expansion (b) and post-expansion (c) images of tyrosinated tubulin signal along with corresponding line profiles (d). Pre-expansion (e) and post-expansion (f) expansion images of a dividing PtK1 cell immunostained for tubulin (green) and the kinetochore protein HEC1 (red) using conventional secondary antibodies and also stained for DNA (blue) using TO-PRO-3. Specimen was treated with GA after immunostain. (g–h) Zoom-in of microtubule-kinetochore attachments from boxed regions in e and f. End-on views of boxed regions in e, f before (i) and after (j) expansion (DNA channel omitted for clarity). (k) Maximum intensity projection of a fixed BS-C-1 cell expressing the endoplasmic reticulum (ER) tag Sec61Β-GFP (green) and the inner mitochondrial membrane tag mito-DsRed (blue) and immunostained against the outer mitochondrial membrane protein TOM20 using a conventional secondary antibody (red). The specimen was treated with GA after immunostain and only briefly digested in order to retain GFP and DsRed fluorescence. (l) Zoom-in of boxed region in k showing close apposition of an ER tubule with two mitochondria. (m) Cross-sectional profile of boxed region in l. All distances and scale bars are in pre-expansion units. Scale bars, (a, i, j, k) 2 µm, (b, c, g, h, l) 500 nm, (e, f) 5 µm.
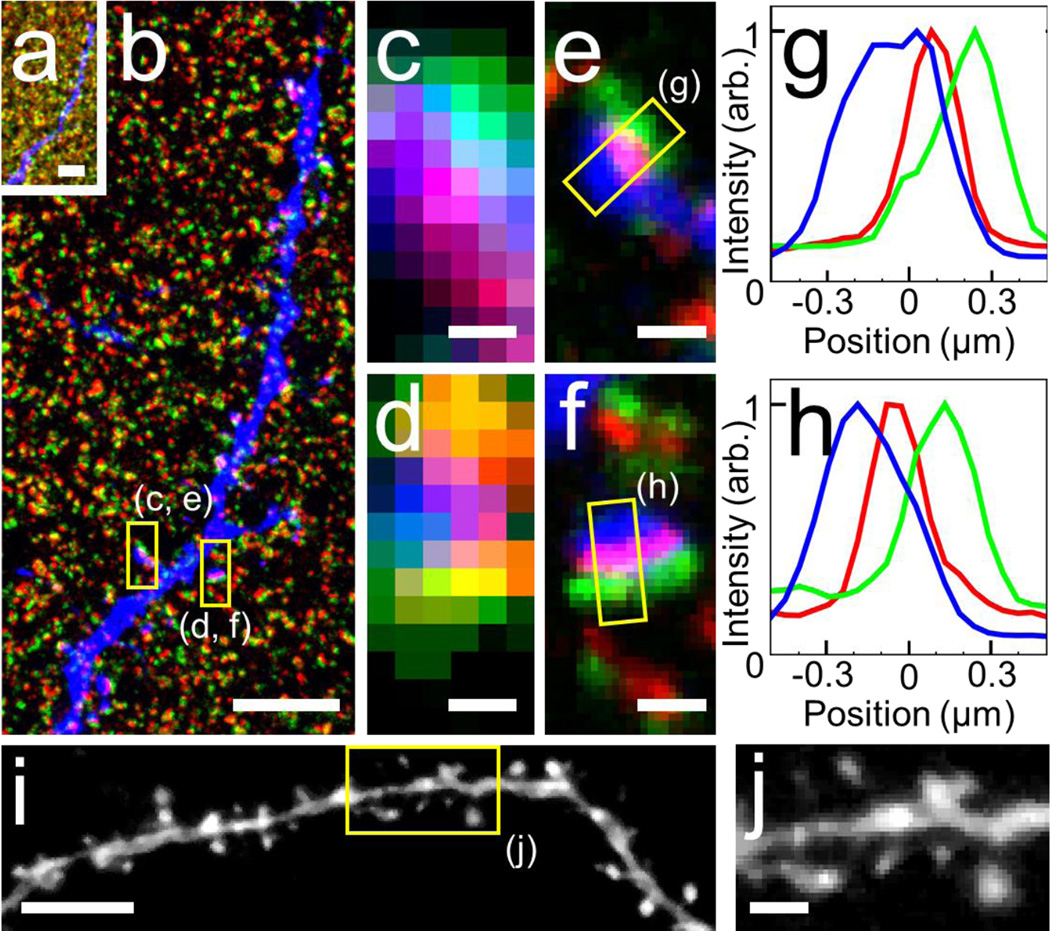
Confocal (a–f) and epifluorescence (i, j) images of expanded mouse brain tissue using the MA-NHS treatment method. (a) Single pre-expansion focal plane of a THY1-YFP-H mouse brain slice indirectly immunostained for YFP (blue), the presynaptic marker Bassoon (green), and the postsynaptic marker Homer (red) using conventional secondary antibodies. (b) The same area in a after expansion, displayed with the relative size compared to a, in order to show the relative amount of physical expansion. Zoom-in of the boxed regions in b before expansion (c, d) and after expansion (e, f), revealing that the presynaptic and postsynaptic markers are well-resolved and aligned with dendritic spines. (g, h) Cross-sectional profiles of the boxed regions in e, f. (i) Epifluorescence image of a neuron in an expanded THY1-YFP-H mouse brain slice using YFP itself as the fluorescence reporter; image was recorded using a 20× 0.45 NA objective lens. The specimen was treated with MA-NHS and only briefly (1 h) digested in order to retain FP fluorescence. (j) Zoom in of the boxed region in i showing clearly resolved dendritic spines. All distances and scale bars correspond to pre-expansion dimensions. Scale bars, (a, b) 5 μm, (c, d, f, g) 500 nm, (i) 4 μm, (f) 1 μm.
Comment in
-
Expansion microscopy passes its first test.Nat Methods. 2016 May 31;13(6):481-2. doi: 10.1038/nmeth.3872. Nat Methods. 2016. PMID: 27243471 No abstract available.
-
Super-resolution microscopy writ large.Nat Biotechnol. 2016 Sep 8;34(9):928-30. doi: 10.1038/nbt.3669. Nat Biotechnol. 2016. PMID: 27606457 No abstract available.
References
Publication types
MeSH terms
Substances
Grants and funding
LinkOut - more resources
Full Text Sources
Other Literature Sources
