

Time trends in cancer incidence in persons living with HIV/AIDS in the antiretroviral therapy era: 1997-2012
- PMID: 27064994
- PMCID: PMC4925286
- DOI: 10.1097/QAD.0000000000001112
Time trends in cancer incidence in persons living with HIV/AIDS in the antiretroviral therapy era: 1997-2012
Abstract
Objective: Utilizing the Veterans Aging Cohort Study, the largest HIV cohort in North America, we conducted one of the few comprehensive comparisons of cancer incidence time trends in HIV-infected (HIV+) versus uninfected persons during the antiretroviral therapy (ART) era.
Design: Prospective cohort study.
Methods: We followed 44 787 HIV+ and 96 852 demographically matched uninfected persons during 1997-2012. We calculated age-, sex-, and race/ethnicity-standardized incidence rates and incidence rate ratios (IRR, HIV+ versus uninfected) over four calendar periods with incidence rate and IRR period trend P values for cancer groupings and specific cancer types.
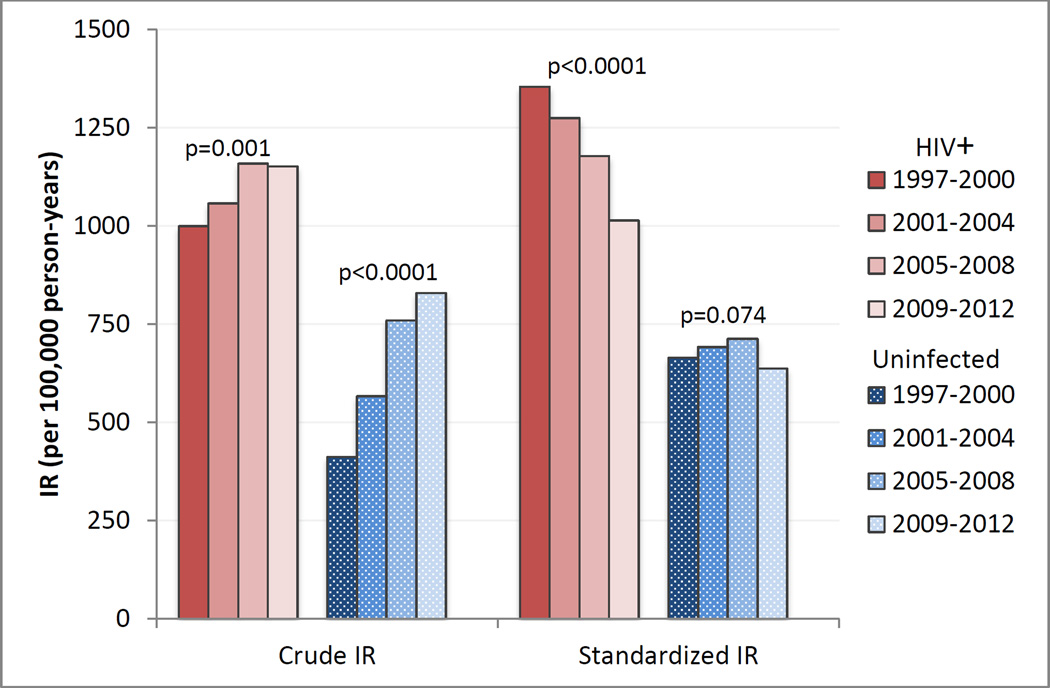
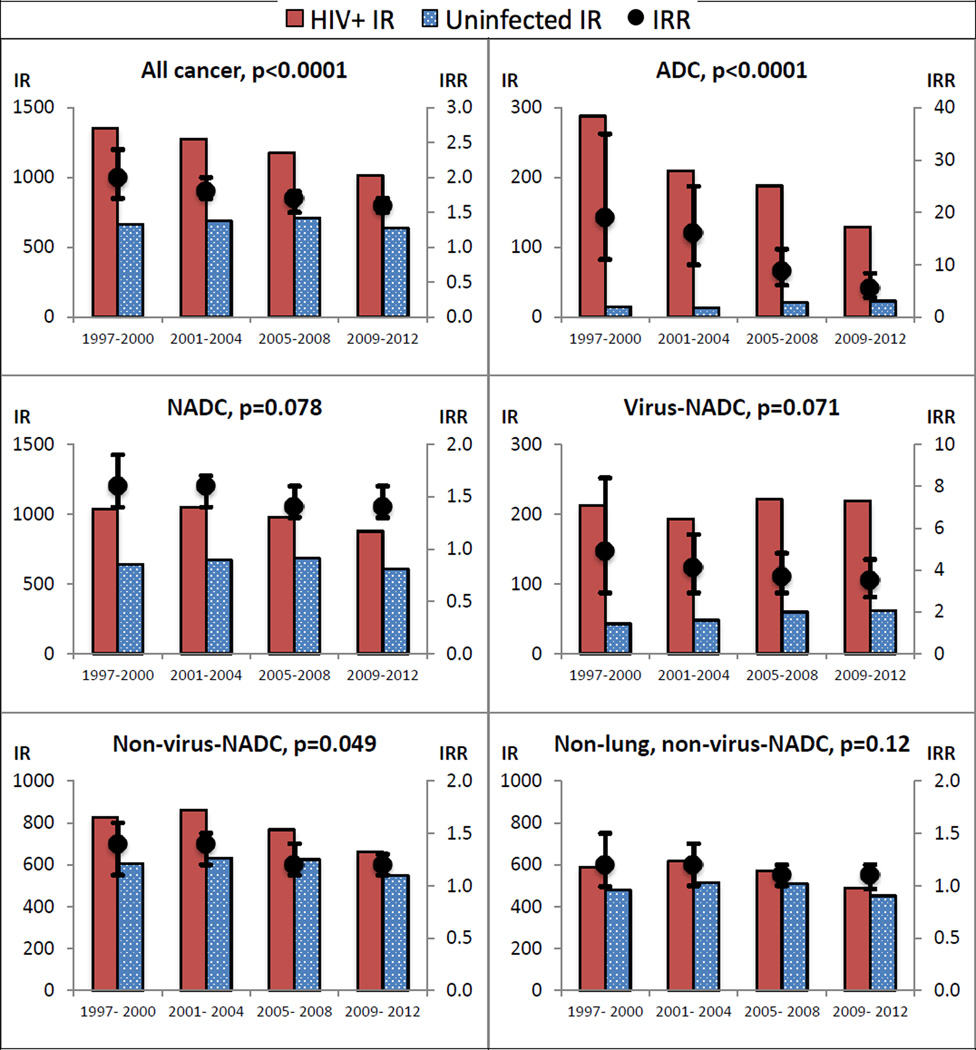
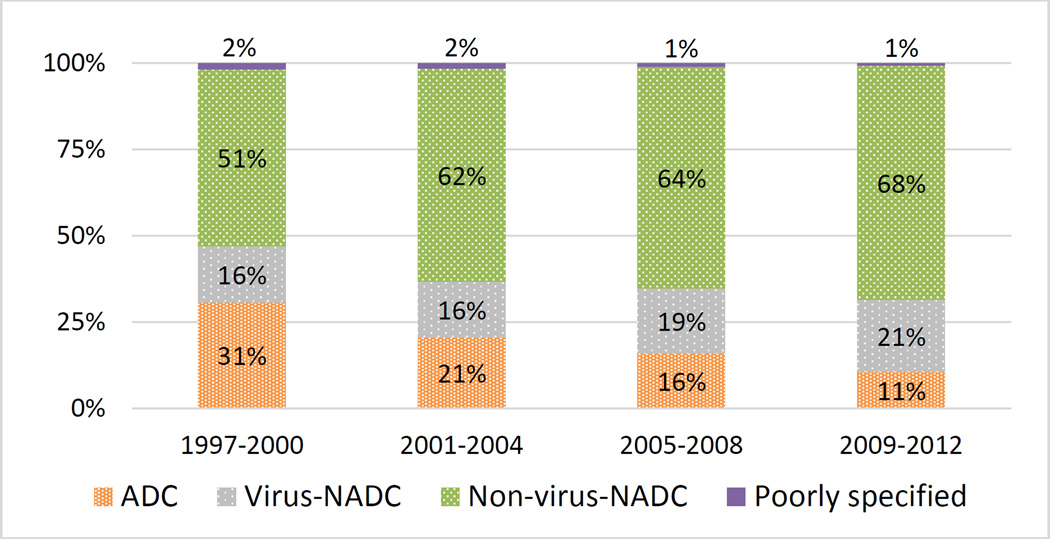
Results: We observed 3714 incident cancer diagnoses in HIV+ and 5760 in uninfected persons. The HIV+ all-cancer crude incidence rate increased between 1997-2000 and 2009-2012 (P trend = 0.0019). However, after standardization, we observed highly significant HIV+ incidence rate declines for all cancer (25% decline; P trend <0.0001), AIDS-defining cancers (55% decline; P trend <0.0001), nonAIDS-defining cancers (NADC; 15% decline; P trend = 0.0003), and nonvirus-related NADC (20% decline; P trend <0.0001); significant IRR declines for all cancer (from 2.0 to 1.6; P trend <0.0001), AIDS-defining cancers (from 19 to 5.5; P trend <0.0001), and nonvirus-related NADC (from 1.4 to 1.2; P trend = 0.049); and borderline significant IRR declines for NADC (from 1.6 to 1.4; P trend = 0.078) and virus-related NADC (from 4.9 to 3.5; P trend = 0.071).
Conclusion: Improved HIV care resulting in improved immune function most likely contributed to the HIV+ incidence rate and the IRR declines. Further promotion of early and sustained ART, improved ART regimens, reduction of traditional cancer risk factor (e.g. smoking) prevalence, and evidence-based screening could contribute to future cancer incidence declines among HIV+ persons.
Figures
References
-
- Morlat P, Roussillon C, Henard S, Salmon D, Bonnet F, Cacoub P, et al. Causes of death among HIV-infected patients in France in 2010 (national survey): trends since 2000. AIDS. 2014;28:1181–1191. - PubMed
-
- Smith CJ, Ryom L, Weber R, Morlat P, Pradier C, Reiss P, et al. Trends in underlying causes of death in people with HIV from 1999 to 2011 (D:A:D): a multicohort collaboration. Lancet. 2014;384:241–248. - PubMed
-
- Weber R, Ruppik M, Rickenbach M, Spoerri A, Furrer H, Battegay M, et al. Decreasing mortality and changing patterns of causes of death in the Swiss HIV Cohort Study. HIV Med. 2013;14:195–207. - PubMed
Publication types
MeSH terms
Substances
Grants and funding
- U24 AA022001/AA/NIAAA NIH HHS/United States
- R01 CA165937/CA/NCI NIH HHS/United States
- P30 MH062294/MH/NIMH NIH HHS/United States
- UL1 TR001863/TR/NCATS NIH HHS/United States
- F31 CA180775/CA/NCI NIH HHS/United States
- T32 MH020031/MH/NIMH NIH HHS/United States
- R01 CA173754/CA/NCI NIH HHS/United States
- T32 DK007217/DK/NIDDK NIH HHS/United States
- U10 AA013566/AA/NIAAA NIH HHS/United States
- U01 AA020790/AA/NIAAA NIH HHS/United States
- U01 AI069918/AI/NIAID NIH HHS/United States
- K07 CA180782/CA/NCI NIH HHS/United States
- KL2 TR001862/TR/NCATS NIH HHS/United States
- U24 AA020794/AA/NIAAA NIH HHS/United States
LinkOut - more resources
Full Text Sources
Other Literature Sources
Medical
