. 2016 May;18(5):504-15.
doi: 10.1038/ncb3339. Epub 2016 Apr 11.

Control of plasma membrane lipid homeostasis by the extended synaptotagmins

Affiliations

Control of plasma membrane lipid homeostasis by the extended synaptotagmins

Yasunori Saheki et al. Nat Cell Biol. 2016 May.

Abstract

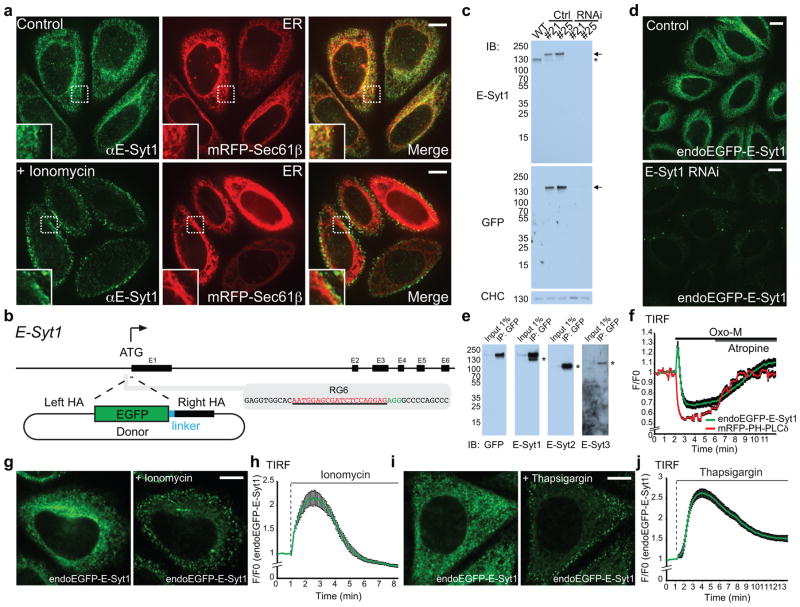
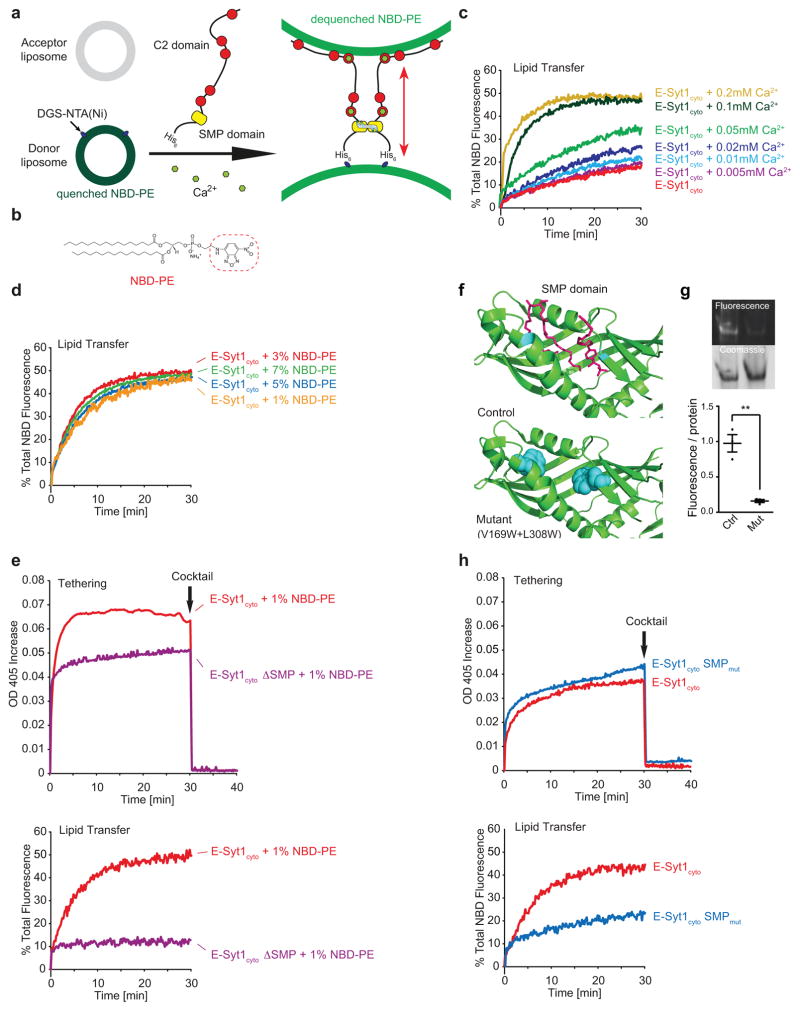
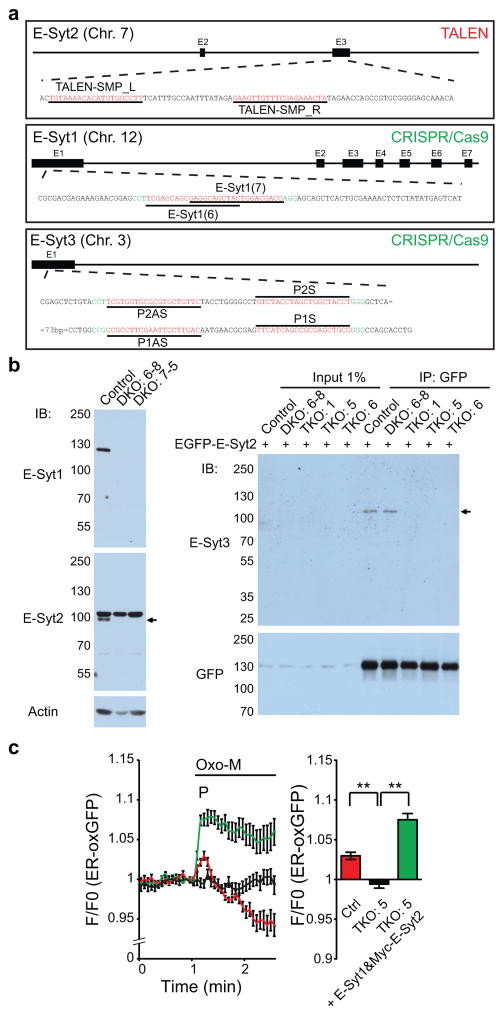
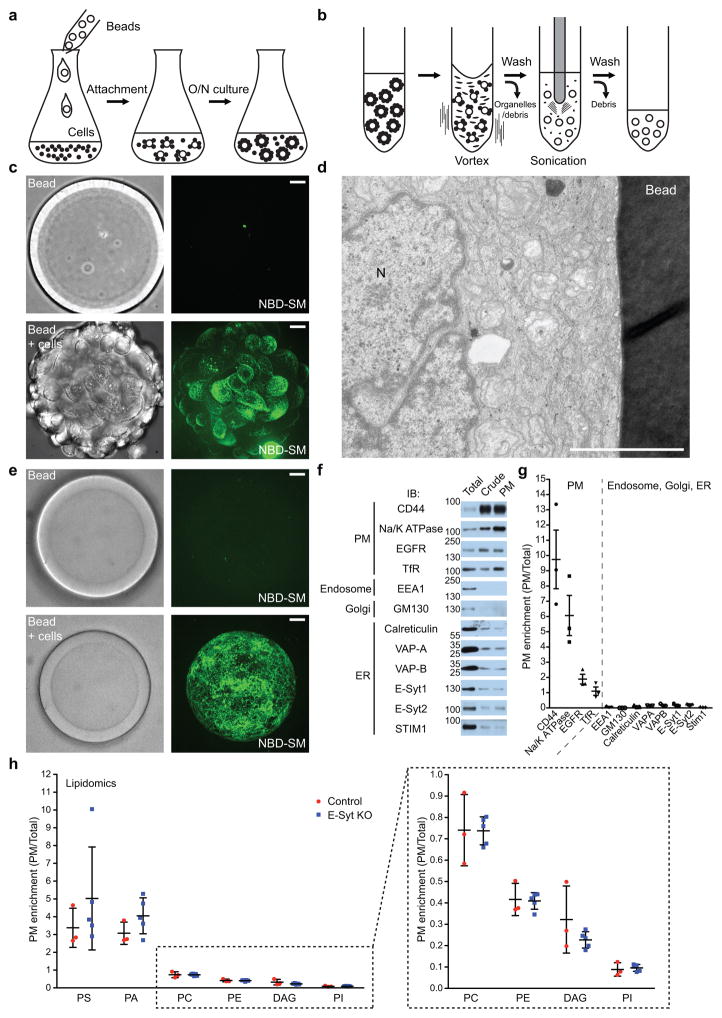
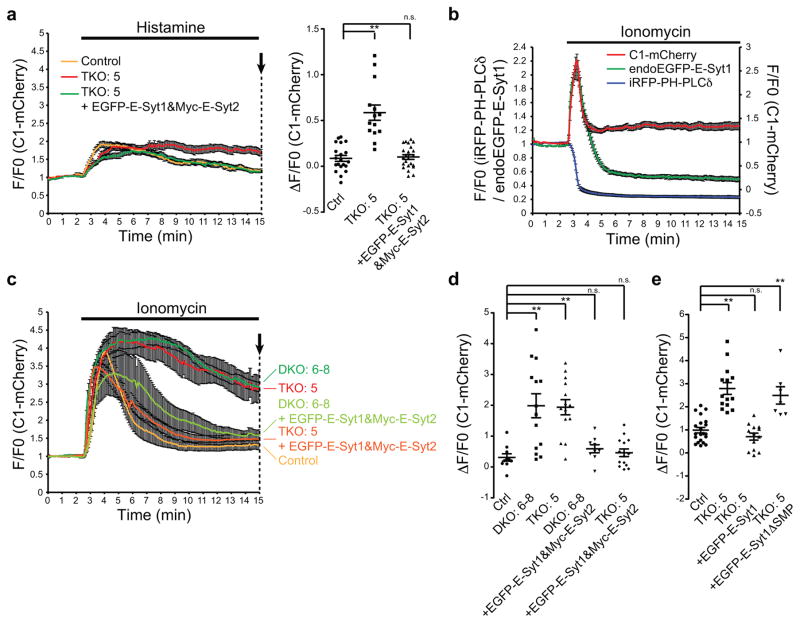
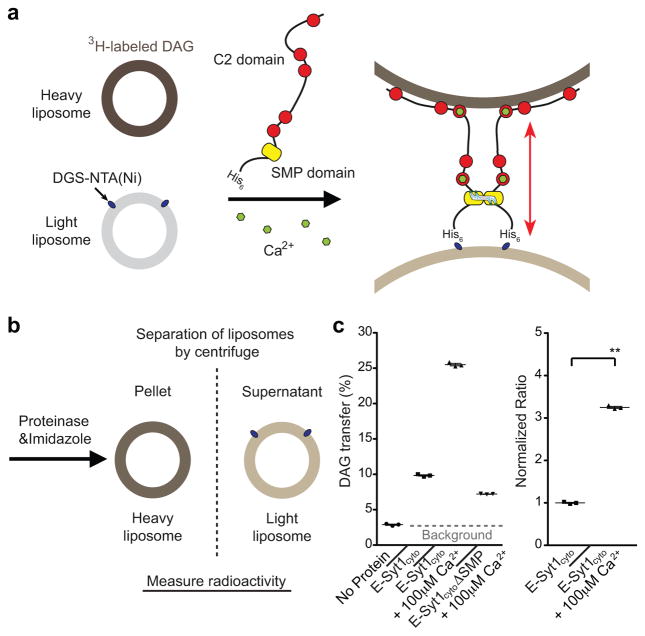
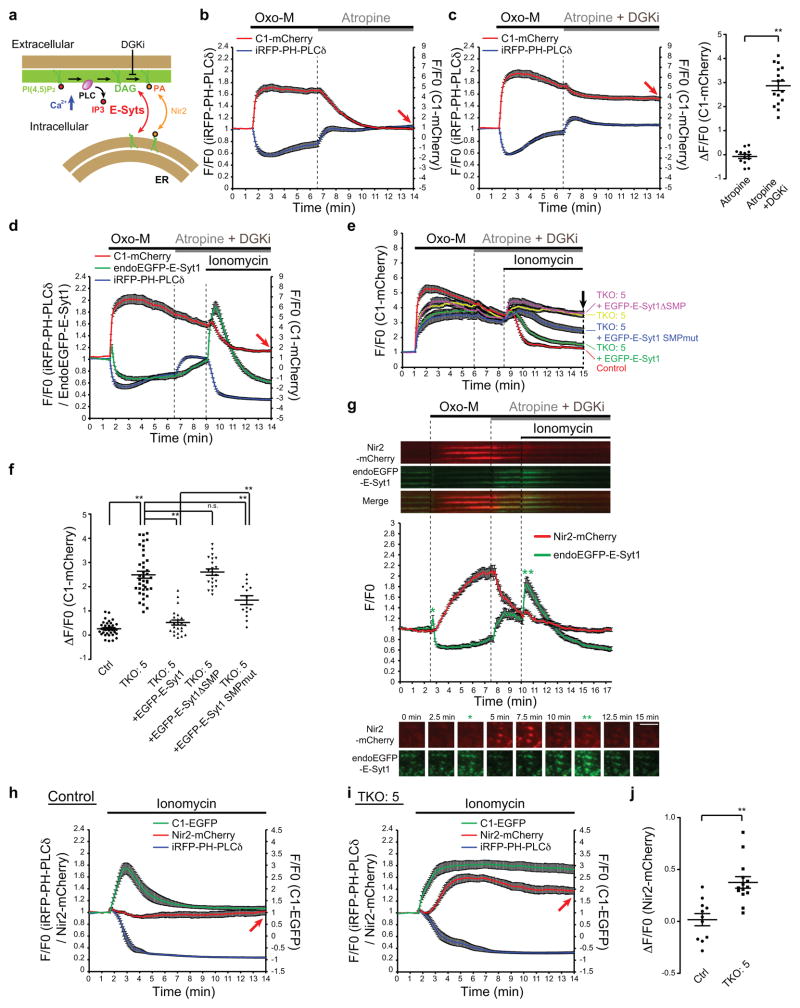
Acute metabolic changes in plasma membrane (PM) lipids, such as those mediating signalling reactions, are rapidly compensated by homeostatic responses whose molecular basis is poorly understood. Here we show that the extended synaptotagmins (E-Syts), endoplasmic reticulum (ER) proteins that function as PtdIns(4,5)P2- and Ca(2+)-regulated tethers to the PM, participate in these responses. E-Syts transfer glycerolipids between bilayers in vitro, and this transfer requires Ca(2+) and their lipid-harbouring SMP domain. Genome-edited cells lacking E-Syts do not exhibit abnormalities in the major glycerolipids at rest, but exhibit enhanced and sustained accumulation of PM diacylglycerol following PtdIns(4,5)P2 hydrolysis by PLC activation, which can be rescued by expression of E-Syt1, but not by mutant E-Syt1 lacking the SMP domain. The formation of E-Syt-dependent ER-PM tethers in response to stimuli that cleave PtdIns(4,5)P2 and elevate Ca(2+) may help reverse accumulation of diacylglycerol in the PM by transferring it to the ER for metabolic recycling.


Figures

Figure 1
Figure 1. Localization of endogenous E-Syt1
(a) Confocal images of HeLa cells expressing mRFP-Sec61β. Localization of endogenous E-Syt1 was detected by an affinity-purified antibody. Insets show at higher magnification the area framed by a dotted line. Bottom images: HeLa cells stimulated with ionomycin (2μM) for 1 min. Note the translocation of the E-Syt1 fluorescent signals to the cortical region of the cell. (b) Strategy for the endogenous-tagging of E-Syt1 (see methods). (c) Lysates of control HeLa cells, two endogenously-tagged HeLa cell lines (#21 and #25), and the same two lines treated with RNAi against endogenous E-Syt1 were processed by SDS-PAGE and immunoblotting (IB) with anti-E-Syt1, anti-GFP and anti-clathrin heavy chain (CHC) antibodies. Arrows and an asterisk indicate endogenously-tagged EGFP-E-Syt1 and endogenous E-Syt1, respectively. (d) Confocal images of live #21 cells showing endogenously-tagged EGFP-E-Syt1 (endoEGFP-E-Syt1) fluorescent signals in control, but not in RNAi-treated cells. (e) Extracts of #21 cells were subjected to anti-GFP immunoprecipitation (IP) and then processed by SDS-PAGE and immunoblotting with indicated antibodies. Asterisks indicate coimmunoprecipitated bands corresponding to endogenous untagged proteins. Note the strong homo- and hetero-dimerization of endogenously-tagged E-Syt1 with endogenous E-Syt1, E-Syt2 and E-Syt3. (f) Time-course of normalized GFP signal, as assessed by TIRF microscopy, from cells expressing endogenously-tagged E-Syt1 as well as muscarinic M1 receptor (M1R) and the PI(4,5)P2 probe, mRFP-PH-PLCδ. Oxo-M (10μM) stimulation and atropine (50μM) application are indicated. The biphasic response of E-Syt1 reflects the increase in cytosolic Ca2+ immediately followed by massive PI(4,5)P2 depletion. (mean +/− SEM, n=16 cells pooled from 2 independent experiments.) (g–j) Confocal images of live clone #21 cells before and 1.5 min after stimulation with ionomycin (2μM) (g) and before and 4 min after stimulation with thapsigargin (2μM) (i). The time-course of ionomycin-induced and thapsigargin-induced recruitment of endoEGFP-E-Syt1 to the PM, as assessed by TIRF microscopy, is shown in (h) and (j) respectively [mean +/− SEM, n=8 cells (h) and 11 cells (j) assessed from 1 experiment, the experiment was repeated independently 3 times with similar results. Scale bars, 10μm. Unprocessed original scans of blots are shown in Supplementary Fig. 7.
Figure 2
Figure 2. E-Syt1 is a Ca2+-dependent lipid transfer protein
(a) Schematics showing the in vitro lipid transfer assay. Donor liposomes [PC, DGS-NTA(Ni), NBD-PE], and acceptor liposomes [PC, PS, PI(4,5)P2] were incubated with histidine (His)-tagged cytosolic portion of E-Syt1 protein (E-Syt1cyto). Dequenching of self-quenched NBD-PE fluorescence, i.e. transfer of the fluorescent lipids from donor to acceptor liposomes, was monitored using a fluorometer (see methods). (b) Structure of NBD-PE. (c) Time-course of normalized fluorescence signals from liposomes mixtures containing 1% NBD-PE in the donor liposomes at the indicated concentration of Ca2+ in the assay buffer. E-Syt1cyto was added at time 0. (d) Time-course of normalized fluorescence signals from E-Syt1cyto/liposome mixtures containing different moles percent of NBD-PE in the donor liposomes and incubated with 100μM Ca2+. (e) (top) Time-course of turbidity of the suspension (see methods). Turbidity reflects liposome clustering due to tethering of donor and acceptor liposomes. (bottom) Time-course of normalized fluorescence signals from liposome mixtures containing 1% NBD-PE in the donor liposomes and either E-Syt1cyto or E-Syt1cyto lacking the SMP domain (E-Syt1cyto ΔSMP). (f) Design of mutant SMP domain defective in lipid harboring. Hydrophobic amino acids lining the deep hydrophobic groove were mutated to tryptophan (W), thus creating steric hindrance to access of acyl chains to the SMP channel. Aromatic rings of tryptophan are shown as surface representation. (g) Lipid-binding of E-Syt1 SMP domain. (top) Purified WT SMP domain (Ctrl) and mutant SMP domain, carrying V169W and L308W mutations (Mut), were incubated with NBD-PE, run on native-PAGE and analyzed by fluorometry and coomassie blue staining; (bottom) Quantification of fluorescence signals of NBD-PE normalized to the total amount of protein (mean +/− SEM, n=3 independent experiments; two-tailed Student’s t-test with equal variance, P=0.0028). (h) (top) Time-course of turbidity of the suspension. (bottom) Time-course of normalized fluorescence signals from liposome mixtures containing 1% NBD-PE in the donor liposomes and either E-Syt1cyto or E-Syt1cyto with lipid-binding deficient SMP domain (E-Syt1cyto SMPmut). The transfer of NBD-PE is much reduced with E-Syt1cyto SMPmut. For all the liposome-based assays, data are from one experiment; three experiments that yielded similar results were performed
Figure 3
Figure 3. Generation of E-Syt1/2 double knockout (DKO) and E-Syt1/2/3 triple knockout (TKO) HeLa cells using TALEN and CRISPR
(a) Schematics of the TALEN- and Cas9/sgRNA-targeting sites in human E-Syt2, E-Syt1 and E-Syt3 loci. The targeting sequence is underlined and highlighted in red. The protospacer-adjacent motif (PAM) is labeled in green for E-Syt1 and E-Syt3 loci. (b) (left) Lysates of control HeLa cells and two independently isolated E-Syt1/2 DKO cell lines were processed by SDS-PAGE and immunoblotting (IB) with anti-E-Syt1, anti-E-Syt2 and anti-actin antibodies. Arrow indicates the specific band for E-Syt2. (right) Extracts of control HeLa cells, clone DKO#6-8 and three clones of E-Syt TKO cells transfected with EGFP-E-Syt2 were subjected to anti-GFP immunoprecipitation (IP) and then processed by SDS-PAGE and immunoblotting with anti-E-Syt3 and anti-GFP antibodies. Arrow indicates coimmunoprecipitated bands. Note the absence of IP-enriched E-Syt3 expression in E-Syt TKO cells. (c) (left) Time-course of normalized GFP signal, as assessed by TIRF microscopy, from WT control (Ctrl) and E-Syt TKO cells expressing a luminal ER marker (ER-oxGFP) and M1R. Oxo-M (10μM) stimulation is indicated. Re-expression of E-Syt1 together with Myc-tagged E-Syt2 (Myc-E-Syt2) in TKO cells rescued the loss of ER dynamics. (right) Quantification of fluorescence corresponding to the peak for each qunatification shown in the left graphs [for both left and right panels, mean +/− SEM, n=7 cells (Ctrl); n=18 cells (TKO#5); n=18 cells (TKO#5 + E-Syt1&Myc-E-Syt2; data are pooled from 3 independent experiments except for Ctrl that is from 1 experiment, the experiment was repeated independently 2 times with similar results); two-tailed Student’s t-test with equal variance, Ctrl: P=0.0028, TKO#5 + E-Syt1&Myc-E-Syt2: P<0.0001]. Unprocessed original scans of blots are shown in Supplementary Fig. 7.
Figure 4
Figure 4. Rapid isolation and characterization of PM sheets
(a) Schematics showing the attachment of HeLa cells to dextran beads. (left) Cells were dissociated and dextran beads were added drop by drop; (middle) A cell-bead mixture was incubated with gentle stirring to allow uniform attachment (right) and further incubated overnight. (b) Schematics showing the isolation of bead-attached PMs. Following a wash, the cell-bead mixture was exposed to a hypotonic buffer and vortexed to lyse cells and remove intracellular organelles. After extensive washes, a sonication pulse was applied to the beads to further remove intracellular organelles/debris from bead-attached PMs. (c) Confocal image of live HeLa cells attached to a bead. Top images: bead without cells. Bottom images: bead coated with HeLa cells as illustrated in a. Maximum projections of the serial Z-stack of confocal images are shown. The bead-attached PMs were stained with NBD-labeled Sphingomyelin (NBD-SM: green). Scale bars, 20μm. (d) Electron micrograph of a HeLa cell attached to a bead. N: nucleus. Scale bar, 5μm. (e) Confocal images of beads after sonication and staining with NBD-SM. Top images: bead not incubated with cells. Bottom images: bead with PM sheets. Scale bars, 20μm. (f) Bead attached material [total lysate (Total), crude PM sheets before sonication (Crude) and final PM sheets (PM)] was processed by SDS-PAGE and immunoblotting (IB) with the indicated antibodies. Note the enrichment of PM proteins and depletion of ER, endosomal and Golgi proteins in the PM fractions. (g) Quantification of protein abundance as analyzed in f. PM enrichment plots the ratio of “PM” over “Total” protein abundance (mean +/− SEM, n=3 extracts). (h) Comparisons of PM glycerolipid proliles of WT (Control) and E-Syt KO HeLa cells (pooled values of DKO and TKO cells) as analyzed by mass spectrometry. PM enrichment plots the ratio of PM lipids over total lipids (see methods) [mean +/− SD, n=3 extracts (Control), n=5 extracts (3 biologically independent samples from DKO#6-8 and 2 biologically independent samples from TKO#5 were pooled as DKO and TKO cells had similar properties in all functional assays consistent with the very low abundance of E-Syt3 in HeLa cells. PS, Phosphatidylserine; PA, Phosphatidic acid; PC Phosphatidylcholine; PE Phosphatidylethanolamine; DAG, Diacylglycerol; PI, Phosphatidylinositol. Unprocessed original scans of blots are shown in Supplementary Fig. 7.
Figure 5
Figure 5. Prolonged accumulation of DAG in E-Syt KO cells upon phospholipase activation
(a) Time-course of normalized mCherry signal, as assessed by TIRF microscopy, from WT control (Ctrl) and E-Syt TKO cells expressing a DAG probe (C1-mCherry). Histamine (1mM) stimulation is indicated. Re-expression of EGFP-tagged E-Syt1 (EGFP-E-Syt1) together with Myc-E-Syt2 in E-Syt TKO cells rescued the accumulation of DAG, as monitored by C1-mCherry. (Right) Values of ΔF/F0 corresponding to the end of the experiment as indicated by an arrow [mean +/− SEM, n=20 cells (Ctrl), n=14 cells (TKO#5), n=23 cells (TKO#5 + EGFP-E-Syt1&Myc-E-Syt2); data are pooled from 2 independent experiments except for Ctrl that is pooled from 3 independent experiments; Bonferroni’s multiple comparisons test, ** denotes P=0.0005] (b) Time-course of normalized EGFP, iRFP (left axis) and mCherry (right axis) signal, as assessed by TIRF microscopy, from cells expressing E-Syt1 tagged with EGFP at the endogenous locus (endoEGFP-E-Syt1) as well as a PI(4,5)P2 probe (iRFP-PH-PLCδ) and a DAG probe (C1-mCherry). Ionomycin (2μM) stimulation is indicated. (mean +/− SEM, n=6 cells assessed from 1 experiment, the experiment was repeated independently 3 times, with similar results) (c,d) (c) Time-course of normalized mCherry signal, as assessed by TIRF microscopy, from WT control (Ctrl), E-Syt1/2 DKO cells and E-Syt TKO cells expressing C1-mCherry. Ionomycin (2μM) stimulation is indicated. Re-expression of EGFP-E-Syt1 together with Myc-E-Syt2 in E-Syt1/2 DKO and E-Syt TKO cells rescued the accumulation of DAG, as monitored by C1-mCherry. (d) Values of ΔF/F0 corresponding to the end of the experiment as indicated by arrow in c [mean +/− SEM, n=10 cells (Ctrl), n=14 cells (DKO#6-8), n=14 cells (TKO#5), n=9 cells (DKO#6-8 + EGFP-E-Syt1&Myc-E-Syt2), n=14 cells (TKO#5 + EGFP-E-Syt1&Myc-E-Syt2); data are pooled from 2 independent experiments for each condition; Bonferroni’s multiple comparisons test P=0.0001 (DKO#6-8); P=0.0002 (TKO#5)] (e) Values of ΔF/F0 corresponding to the end of the experiment as assayed in the same way as in c [mean +/− SEM, n=21 cells (Ctrl), n=14 cells (TKO#5), n=13 cells (TKO#5 + EGFP-E-Syt1), n=7 cells (TKO#5 + EGFP-E-Syt1ΔSMP); data are pooled from 2 independent experiments except for TKO#5 + EGFP-E-Syt1ΔSMP that is assessed from 1 experiment, the experiment was repeated independently 2 times, with similar results; Bonferroni’s multiple comparisons test, ** denotes P<0.0001]. n.s. = not significant (cut-off P>0.05).
Figure 6
Figure 6. SMP domain-dependent and Ca2+-regulated diacylglycerol transfer by E-Syt1
(a) Schematics of the 3H-DAG in vitro transfer assay. (b) A mixture of “heavy” donor liposomes containing 3H-DAG and of “light” acceptor liposomes was incubated for 10 min in the presence of 100μM Ca2+ and either E-Syt1cyto or E-Syt1cyto lacking the SMP domain (E-Syt1cytoΔSMP). Next the two populations of liposomes were separated by addition of proteinase K and imidazole followed by centrifugation. (c) Quantification of DAG transfer. (left) Values are plotted as percentage (%) of 3H radioactivity in the supernatant (i.e. light acceptor liposomes) over the sum of the total radioactivity in the supernatant and pellet (i.e. light and heavy donor liposomes). (right) Normalized Ca2+-dependence of E-Syt1-mediated DAG transfer was plotted after background subtraction (mean +/− SEM, n=3 independent experiments for all the conditions; two-tailed Student’s t-test with equal variance, ** denotes P<0.0001).
Figure 7
Figure 7. PM DAG extraction mediated by E-Syts
(a) Schematics of possible role of E-Syts in the regulation of PM DAG dynamics during PLC activation. (b,c) Time-course of normalized fluorescence signal in response to (b) Oxo-M (10μM) and atropine (50μM) or (c) Oxo-M (10μM) and atropine plus DGKi (50μM each), as assessed by TIRF microscopy, from cells expressing M1R, iRFP-PH-PLCδ and C1-mCherry. (c,right) Values of ΔF/F0 corresponding to the end of the experiment as shown with red arrows in (b) and (c) [mean +/− SEM, n=13 cells (Atropine), n=16 cells (Atropine+DGKi);two-tailed Student’s t-test with unequal variance,** denotes P<0.0001]. Data are pooled from 2 independent experiments for each condition. (d) Time-course of normalized fluorescence signal, in response to the indicated compounds, as assessed by TIRF microscopy, from cells expressing endogenously-tagged E-Syt1 co-expressing M1R, iRFP-PH-PLCδ and C1-mCherry. Compare the C1-mCherry signals indicated by the red arrow with the values in c. (mean +/− SEM, n=20 cells pooled from 3 independent experiments) (e) Time-course of normalized mCherry signal, in response to the indicated compounds, as assessed by TIRF microscopy, from WT control and E-Syt TKO cells expressing C1-mCherry. (f) Values of F/F0 corresponding to the end of the experiment as shown in (e) by an arrow [mean +/− SEM, n=33 cells pooled from 5 independent experiments (Ctrl), n=39 cells pooled from 6 independent experiments (TKO#5), n=24 cells pooled from 4 independent experiments (TKO#5 + EGFP-E-Syt1), n=21 cells pooled from 3 independent experiments (TKO#5 + EGFP-E-Syt1ΔSMP), n=14 cells pooled from 2 independent experiments (TKO#5 + EGFP-E-Syt1ΔSMPmut);Bonferroni’s multiple comparisons test, ** denotes P<0.0001 except P=0.0002 for TKO#5 + EGFP-E-Syt1 v.s. TKO#5 + EGFP-E-Syt1ΔSMPmut]. (g) Time-course of normalized fluorescence signal, in response to the indicated compounds, as assessed by TIRF microscopy of cells expressing endogenously-tagged E-Syt1 co-expressing M1R, and Nir2-fused with mCherry(Nir2-mCherry). mean +/− SEM, n=20 Nir2 positive ER-PM contacts from 2 individual cells. Representative kymographs (top) and snap shots (bottom) of ER-PM contacts at different times are shown. Green asterisks indicate E-Syt1 recruitment. Scale bar, 5μm. n.s.=not significant. (h–j) Time-course of normalized fluorescence signal, as assessed by TIRF microscopy, from WT control (h) and E-Syt TKO cells (i) expressing Nir2-mCherry, iRFP-PH-PLCδ and C1-EGFP. Ionomycin (2μM) addition is indicated. (j) Values of ΔF/F0 corresponding to the end of the incubation as shown with red arrows [mean +/− SEM, n=11 cells pooled from 3 independent experiments (Ctrl), n=14 cells pooled from 4 independent experiments (TKO#5);two-tailed Student’s t-test with equal variance, P=0.0002].

Comment in

References

    1. Holthuis JC, Levine TP. Lipid traffic: floppy drives and a superhighway. Nature reviews. Molecular cell biology. 2005;6:209–220. - PubMed
    1. Elbaz Y, Schuldiner M. Staying in touch: the molecular era of organelle contact sites. Trends in biochemical sciences. 2011;36:616–623. - PubMed
    1. Friedman JR, Voeltz GK. The ER in 3D: a multifunctional dynamic membrane network. Trends in cell biology. 2011;21:709–717. - PMC - PubMed
    1. Toulmay A, Prinz WA. Lipid transfer and signaling at organelle contact sites: the tip of the iceberg. Current opinion in cell biology. 2011;23:458–463. - PMC - PubMed
    1. Stefan CJ, et al. Osh proteins regulate phosphoinositide metabolism at ER-plasma membrane contact sites. Cell. 2011;144:389–401. - PubMed

Publication types