

Chimeric Sex-Determining Chromosomal Regions and Dysregulation of Cell-Type Identity in a Sterile Zygosaccharomyces Allodiploid Yeast
- PMID: 27065237
- PMCID: PMC4827841
- DOI: 10.1371/journal.pone.0152558
Chimeric Sex-Determining Chromosomal Regions and Dysregulation of Cell-Type Identity in a Sterile Zygosaccharomyces Allodiploid Yeast
Abstract
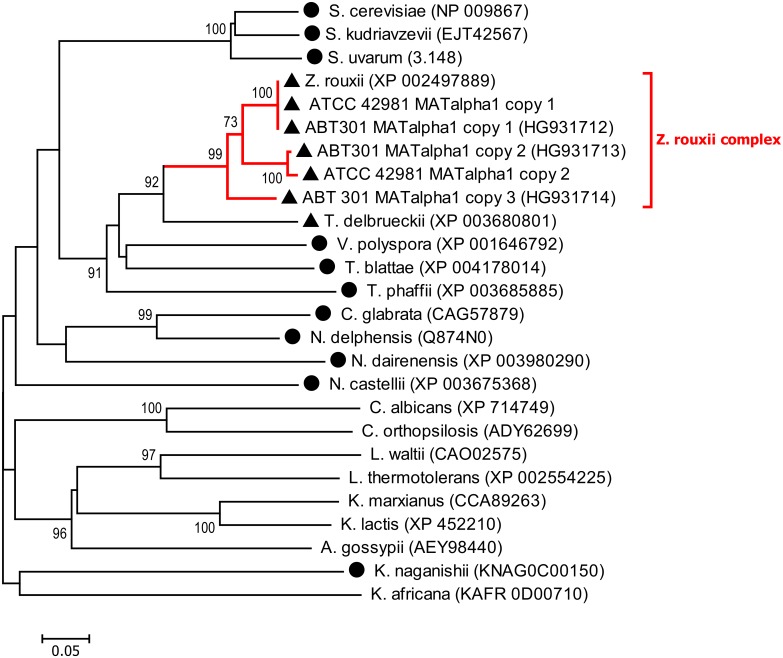
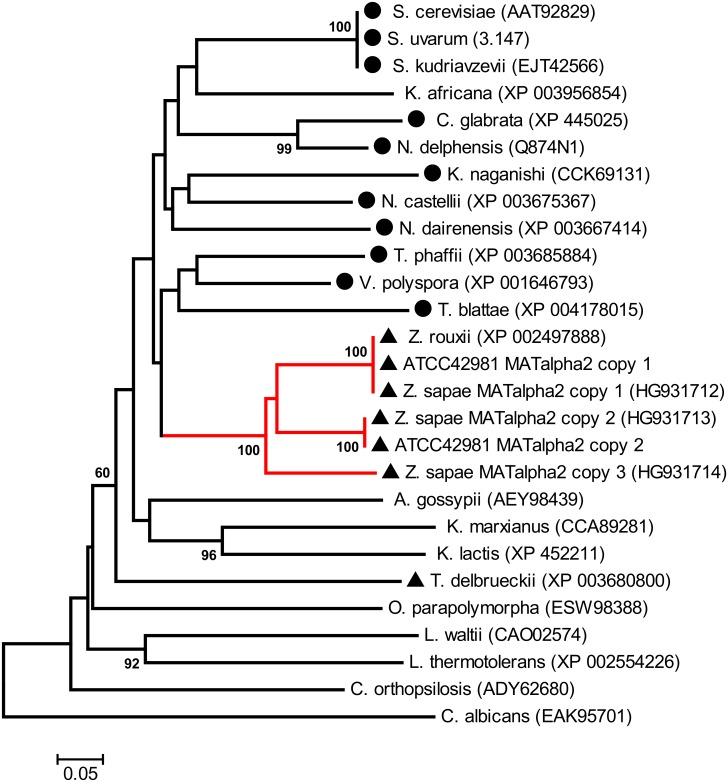
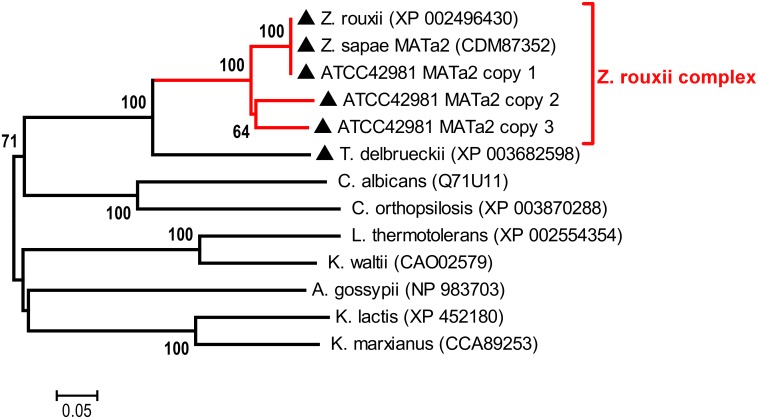
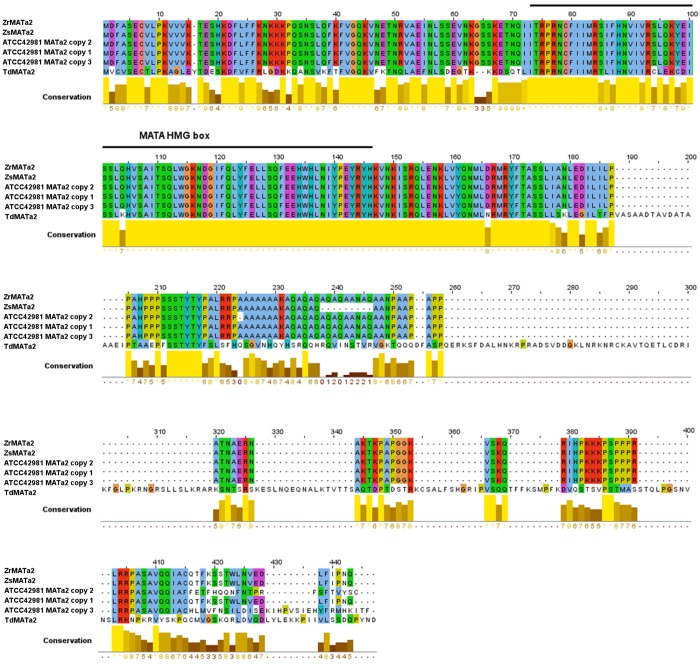
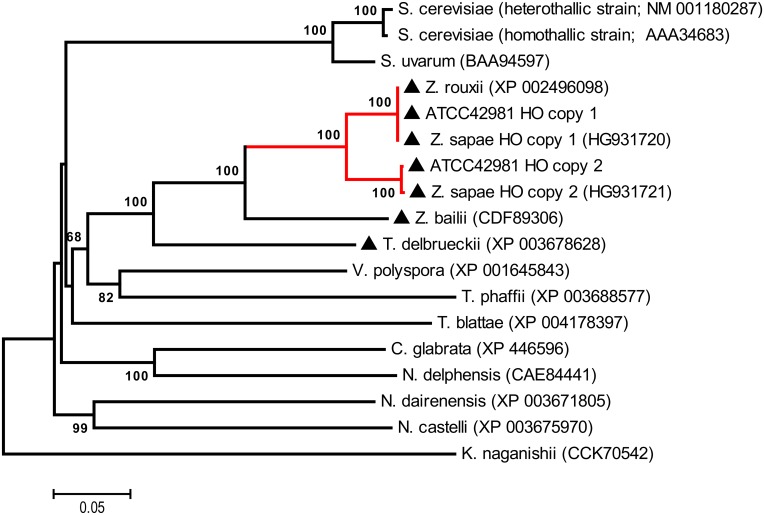
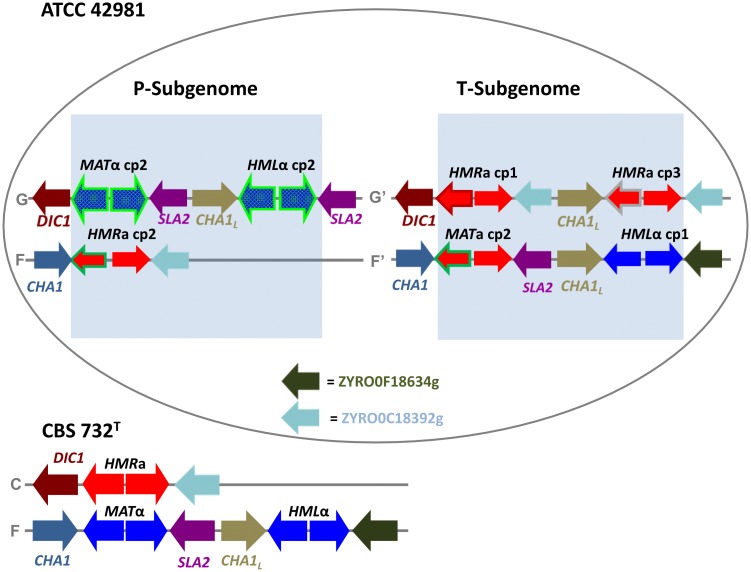
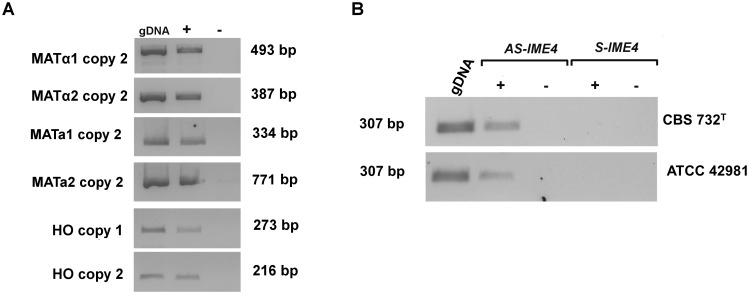
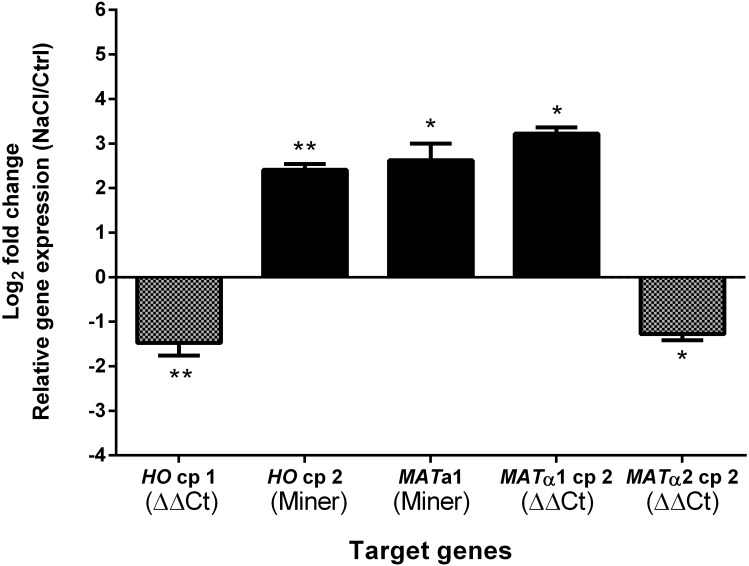
Allodiploidization is a fundamental yet evolutionarily poorly characterized event, which impacts genome evolution and heredity, controlling organismal development and polyploid cell-types. In this study, we investigated the sex determination system in the allodiploid and sterile ATCC 42981 yeast, a member of the Zygosaccharomyces rouxii species complex, and used it to study how a chimeric mating-type gene repertoire contributes to hybrid reproductive isolation. We found that ATCC 42981 has 7 MAT-like (MTL) loci, 3 of which encode α-idiomorph and 4 encode a-idiomorph. Two phylogenetically divergent MAT expression loci were identified on different chromosomes, accounting for a hybrid a/α genotype. Furthermore, extra a-idimorph-encoding loci (termed MTLa copies 1 to 3) were recognized, which shared the same MATa1 ORFs but diverged for MATa2 genes. Each MAT expression locus was linked to a HML silent cassette, while the corresponding HMR loci were located on another chromosome. Two putative parental sex chromosome pairs contributed to this unusual genomic architecture: one came from an as-yet-undescribed taxon, which has the NCYC 3042 strain as a unique representative, while the other did not match any MAT-HML and HMR organizations previously described in Z. rouxii species. This chimeric rearrangement produces two copies of the HO gene, which encode for putatively functional endonucleases essential for mating-type switching. Although both a and α coding sequences, which are required to obtain a functional cell-type a1-α2 regulator, were present in the allodiploid ATCC 42981 genome, the transcriptional circuit, which regulates entry into meiosis in response to meiosis-inducing salt stress, appeared to be turned off. Furthermore, haploid and α-specific genes, such as MATα1 and HO, were observed to be actively transcribed and up-regulated under hypersaline stress. Overall, these evidences demonstrate that ATCC 42981 is unable to repress haploid α-specific genes and to activate meiosis in response to stress. We argue that sequence divergence within the chimeric a1-α2 heterodimer could be involved in the generation of negative epistasis, contributing to the allodiploid sterility and the dysregulation of cell identity.
Conflict of interest statement
Figures
Similar articles
-
Sex-determination system in the diploid yeast Zygosaccharomyces sapae.G3 (Bethesda). 2014 Jun 17;4(6):1011-25. doi: 10.1534/g3.114.010405. G3 (Bethesda). 2014. PMID: 24939186 Free PMC article.
-
Mechanism for Restoration of Fertility in Hybrid Zygosaccharomyces rouxii Generated by Interspecies Hybridization.Appl Environ Microbiol. 2017 Oct 17;83(21):e01187-17. doi: 10.1128/AEM.01187-17. Print 2017 Nov 1. Appl Environ Microbiol. 2017. PMID: 28842546 Free PMC article.
-
Mating-type switching in CBS 732T derived subcultures unveils potential genetic and phenotypic novelties in haploid Zygosaccharomyces rouxii.FEMS Microbiol Lett. 2018 Feb 1;365(2). doi: 10.1093/femsle/fnx263. FEMS Microbiol Lett. 2018. PMID: 29228275
-
The mating type-like loci of Candida glabrata.Rev Iberoam Micol. 2014 Jan-Mar;31(1):30-4. doi: 10.1016/j.riam.2013.09.016. Epub 2013 Nov 16. Rev Iberoam Micol. 2014. PMID: 24252826 Review.
-
Mating-type genes and MAT switching in Saccharomyces cerevisiae.Genetics. 2012 May;191(1):33-64. doi: 10.1534/genetics.111.134577. Genetics. 2012. PMID: 22555442 Free PMC article. Review.
Cited by
-
Insights on life cycle and cell identity regulatory circuits for unlocking genetic improvement in Zygosaccharomyces and Kluyveromyces yeasts.FEMS Yeast Res. 2021 Dec 15;21(8):foab058. doi: 10.1093/femsyr/foab058. FEMS Yeast Res. 2021. PMID: 34791177 Free PMC article.
-
The revenge of Zygosaccharomyces yeasts in food biotechnology and applied microbiology.World J Microbiol Biotechnol. 2021 May 10;37(6):96. doi: 10.1007/s11274-021-03066-7. World J Microbiol Biotechnol. 2021. PMID: 33969449 Review.
-
Draft Genome Sequences of the Highly Halotolerant Strain Zygosaccharomyces rouxii ATCC 42981 and the Novel Allodiploid Strain Zygosaccharomyces sapae ATB301T Obtained Using the MinION Platform.Microbiol Resour Announc. 2018 Aug 2;7(4):e00874-18. doi: 10.1128/MRA.00874-18. eCollection 2018 Aug. Microbiol Resour Announc. 2018. PMID: 30533882 Free PMC article.
-
Evolutionary restoration of fertility in an interspecies hybrid yeast, by whole-genome duplication after a failed mating-type switch.PLoS Biol. 2017 May 16;15(5):e2002128. doi: 10.1371/journal.pbio.2002128. eCollection 2017 May. PLoS Biol. 2017. PMID: 28510588 Free PMC article.
-
Interplay of Chimeric Mating-Type Loci Impairs Fertility Rescue and Accounts for Intra-Strain Variability in Zygosaccharomyces rouxii Interspecies Hybrid ATCC42981.Front Genet. 2019 Mar 1;10:137. doi: 10.3389/fgene.2019.00137. eCollection 2019. Front Genet. 2019. PMID: 30881382 Free PMC article.
References
-
- Kellis M, Patterson N, Endrizzi M, Birren B, Lander ES. Sequencing and comparison of yeast species to identify genes and regulatory elements. Nature. 2003;423(6937): 241–54. - PubMed
-
- Rieseberg LH, Raymond O, Rosenthal DM, Lai Z, Livingstone K, Nakazato T, et al. Major ecological transitions in wild sunflowers facilitated by hybridization. Science. 2003;301(5637): 1211–6. - PubMed
MeSH terms
Substances
LinkOut - more resources
Full Text Sources
Other Literature Sources
Miscellaneous
