. 2016 Mar 31:7:85.
doi: 10.3389/fphar.2016.00085. eCollection 2016.

Untargeted Metabolomics Reveals Dose-Response Characteristics for Effect of Rhubarb in a Rat Model of Cholestasis

Affiliations

Untargeted Metabolomics Reveals Dose-Response Characteristics for Effect of Rhubarb in a Rat Model of Cholestasis

Cong-En Zhang et al. Front Pharmacol. .

Abstract

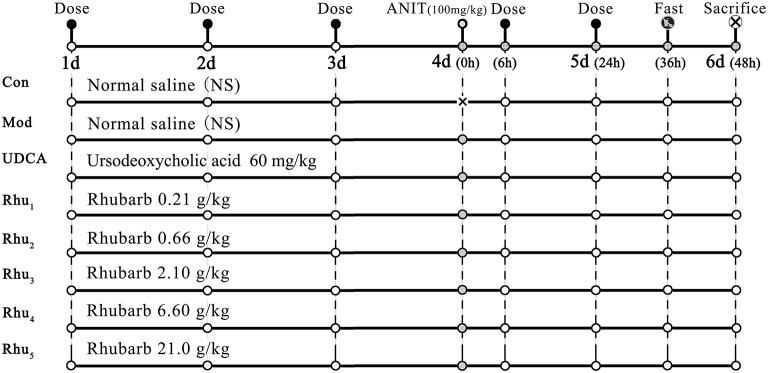
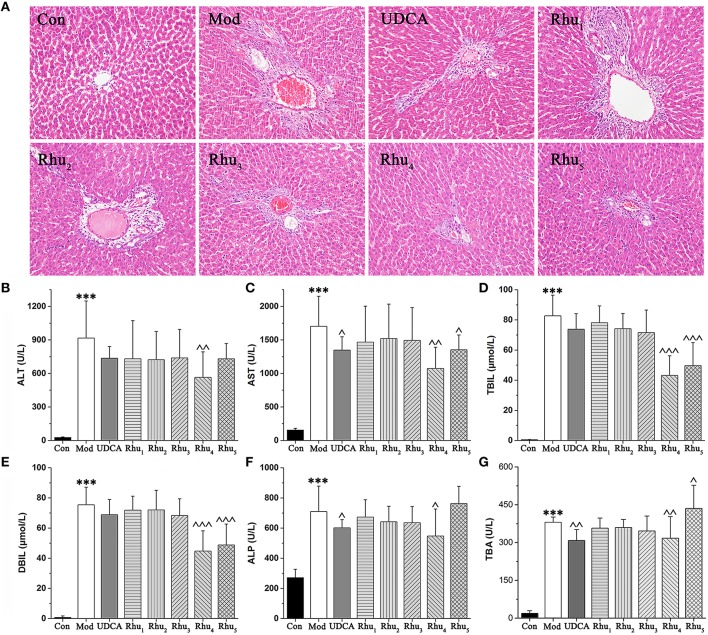
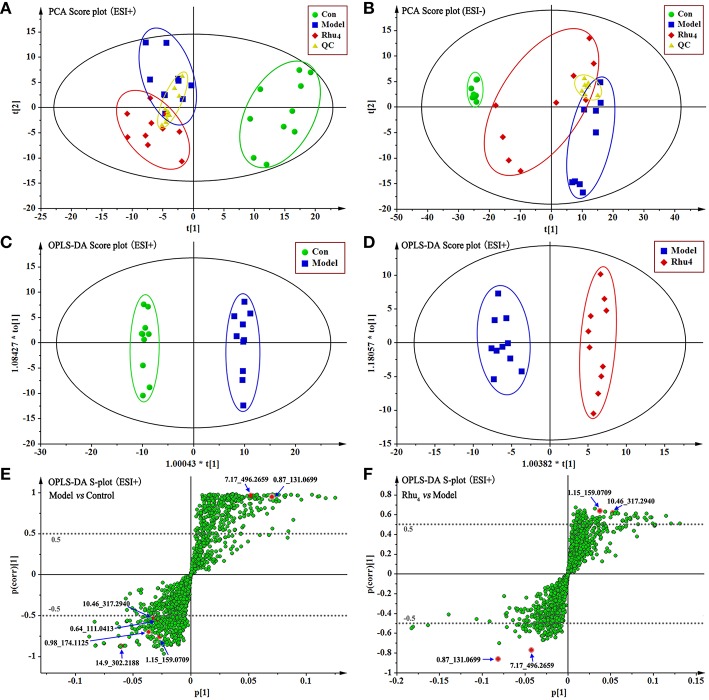
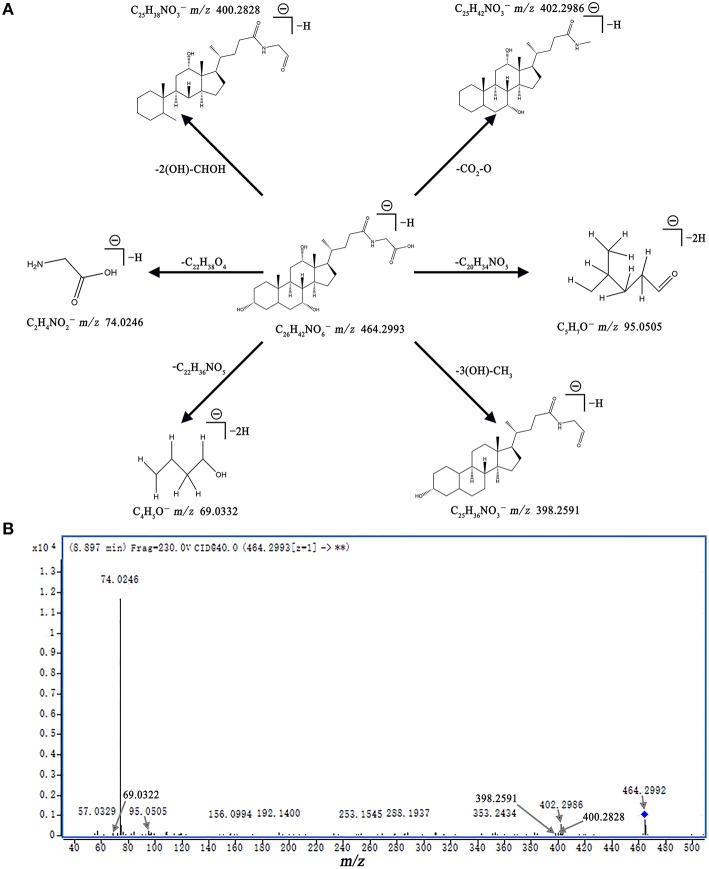
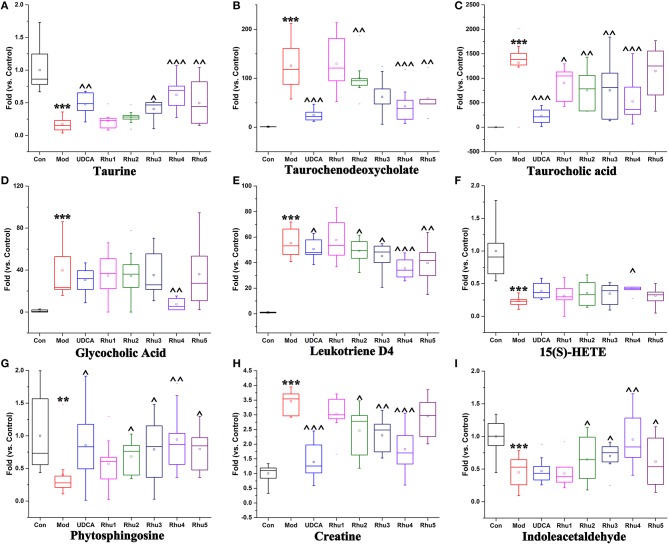
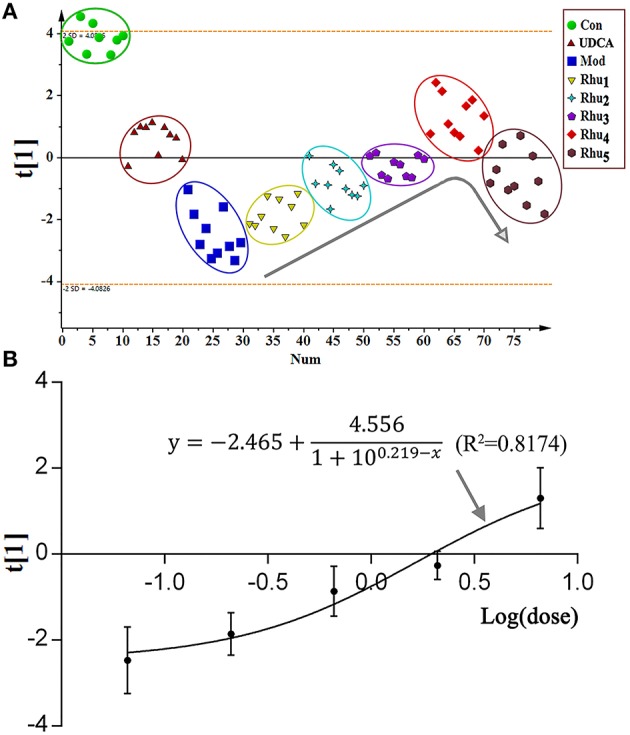
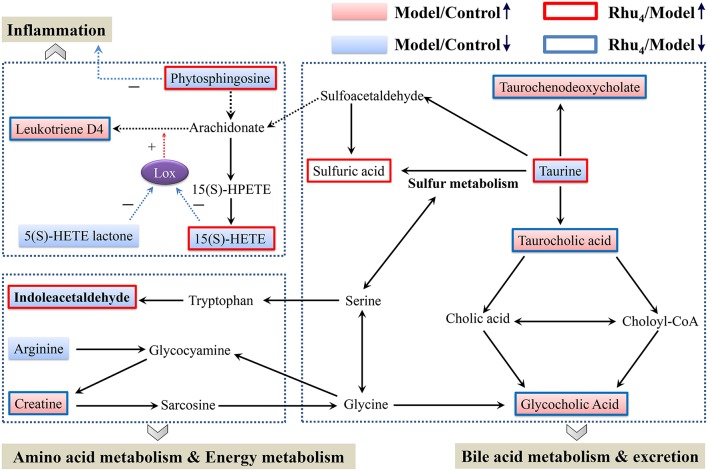
Cholestasis is a serious manifestation of liver diseases with limited therapies. Rhubarb, a widely used herbal medicine, has been frequently used at a relatively large dose for treating cholestasis. However, whether large doses are optimal and the therapeutic mechanism remain unclear. To explore these questions, the anti-cholestatic effect of five doses of rhubarb (0.21, 0.66, 2.10, 6.60, and 21.0 g/kg) in an alpha-naphthylisothiocyanate (ANIT)-induced rat model of cholestasis was examined by histopathology and serum biochemistry. A dose-dependent anti-cholestatic effect of rhubarb (0.21-6.6 g/kg) was observed, and an overdose of 21.0 g/kg showed a poor effect. LC-MS-based untargeted metabolomics together with pathway analysis were further applied to characterize the metabolic alterations induced by the different rhubarb doses. Altogether, 13 biomarkers were identified. The dose-response curve based on nine important biomarkers indicated that doses in the 0.42-6.61 g/kg range (EC20-EC80 range, corresponding to 4.00-62.95 g in the clinic) were effective for cholestasis treatment. The pathway analysis showed that bile acid metabolism and excretion, inflammation and amino acid metabolism were altered by rhubarb in a dose-dependent manner and might be involved in the dose-response relationship and therapeutic mechanism of rhubarb for cholestasis treatment.

Keywords: cholestasis; dose response; metabolomics; pathway analysis; rhubarb.


Figures

Figure 1
Figure 1
The schematic diagram of the animal experimental design. Con, control group treated with normal saline; Mod, model group treated with normal saline; UDCA, positive control group treated with ursodeoxycholic acid; Rhu1 – Rhu5, rats treated with rhubarb extract at doses of 0.21, 0.66, 2.10, 6.60, and 21.0 g/kg, respectively. × in the figure indicates rats without ANIT treatment.
Figure 2
Figure 2
(A) Typical histopathological section photographs of rat liver specimens for H&E analysis (200 × magnification). (B–G) Shown are the serum ALT, AST, TBIL, DBIL, ALP and TBA levels, respectively. ALT, alanine aminotransferase; AST, aspartate aminotransferase; TBIL, serum total bilirubin; DBIL, serum direct bilirubin; ALP, alkaline phosphatase; TBA, total bile acid. ANOVA with the post hoc test was used to calculate the significance of the differences, *** represents p < 0.01 compared with the control group, ^, ^^, and ^^^ represent p < 0.05, p < 0.01 and p < 0.001 compared with the model group, respectively.
Figure 3
Figure 3
The score plots of Con, Model, Rhu4, and QC from PCA in the ESI+ mode (A) and ESI− mode (B) for PC1 vs. PC2. QC indicates the quality control group. OPLS-DA analysis of the data derived from the ESI+ mode. OPLS-DA score plots for the pair-wise comparisons between the Con and Model (C) and the Model and Rhu4 (D). S-plot of the OPLS-DA model for the Con and Model (E) and the Model and Rhu4 (F), the axes that are plotted in the S-plot from the predictive component are p1 vs. p(corr)1, representing the magnitude (modeled covariation) and reliability (modeled correlation) respectively. The points in red indicate the identified biomarkers.
Figure 4
Figure 4
Mass spectra and mass fragment information for glycocholic acid. The proposed MS fragmentation mechanism (A) and product ion spectrum of glycocholic acid in ESI− mode (B).
Figure 5
Figure 5
Variations in the trends of the metabolites that are biomarkers of both cholestasis and rhubarb treatment. (A–I) Shown are the variations in the trends of taurine, taurochenodeoxycholate, taurocholic acid, glycocholic acid, leukotriene D4, 15(S)-HETE, phytosphingosine, creatine and indoleacetaldehyde, respectively. ** and *** represent p < 0.01 and 0.001 compared with the control group, respectively. ^, ^^, and ^^^ represent p < 0.05, 0.01 and 0.001 compared with the model group, respectively.
Figure 6
Figure 6
(A) The score plot of the PCA model. The normalized peak areas of the nine significantly altered potential biomarkers were used as the corresponding variables. All groups were highlighted by a surrounding circle in a corresponding color. The arrow in the figure shows the metabolic changes with the increasing dose of rhubarb. (B) The dose-response curve is provided for the effect indicator (scores of the first principal component) and rhubarb at different doses.
Figure 7
Figure 7
Schematic diagram of the disturbed metabolic pathway related to ANIT and rhubarb treatment. The pink and light blue boxes indicate metabolites significantly higher and lower in the model group than in the control group, respectively. The boxes bordered in red and blue represent metabolites that are significantly higher and lower in the Rhu4 group than in control group, respectively. Lox in the figure stands for lipoxygenase.

Similar articles

Cited by

References

    1. Aoki M., Konya Y., Takagaki T., Umemura K., Sogame Y., Katsumata T., et al. . (2011). Metabolomic investigation of cholestasis in a rat model using ultra-performance liquid chromatography/tandem mass spectrometry. Rapid Commun. Mass Spectrom. 25, 1847–1852. 10.1002/rcm.5072 - DOI - PubMed
    1. Bacq Y., Sentilhes L., Reyes H. B., Glantz A., Kondrackiene J., Binder T., et al. . (2012). Efficacy of ursodeoxycholic acid in treating intrahepatic cholestasis of pregnancy: a meta-analysis. Gastroenterology 143, 1492–1501. 10.1053/j.gastro.2012.08.004 - DOI - PubMed
    1. Bender R., Lange S. (2001). Adjusting for multiple testing—when and how? J. Clin. Epidemiol. 54, 343–349. 10.1016/S0895-4356(00)00314-0 - DOI - PubMed
    1. Beuers U., Trauner M., Jansen P., Poupon R. (2015). New paradigms in the treatment of hepatic cholestasis: from UDCA to FXR, PXR and beyond. J. Hepatol. 62, S25–S37. 10.1016/j.jhep.2015.02.023 - DOI - PubMed
    1. Beuers U. (2006). Drug insight: mechanisms and sites of action of ursodeoxycholic acid in cholestasis. Nat. Clin. Practice Gastroenterol. Hepatol. 3, 318–328. 10.1038/ncpgasthep0521 - DOI - PubMed

LinkOut - more resources