. 2016 Apr 11;12(4):e1004804.
doi: 10.1371/journal.pcbi.1004804. eCollection 2016 Apr.

Computational and Empirical Studies Predict Mycobacterium tuberculosis-Specific T Cells as a Biomarker for Infection Outcome

Affiliations

Computational and Empirical Studies Predict Mycobacterium tuberculosis-Specific T Cells as a Biomarker for Infection Outcome

Simeone Marino et al. PLoS Comput Biol. .

Abstract

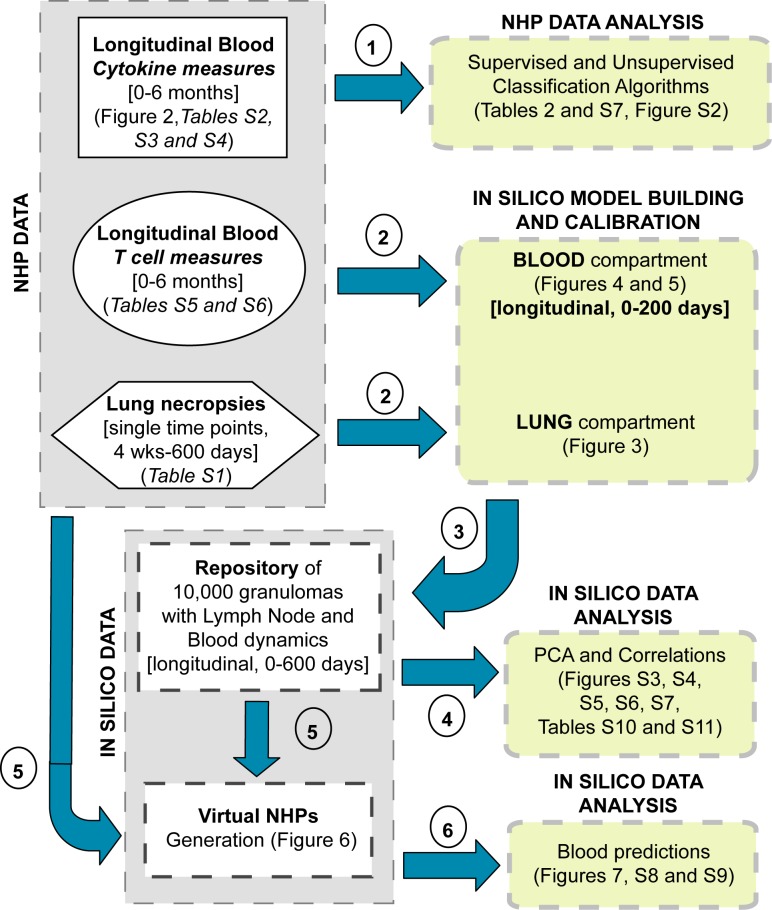
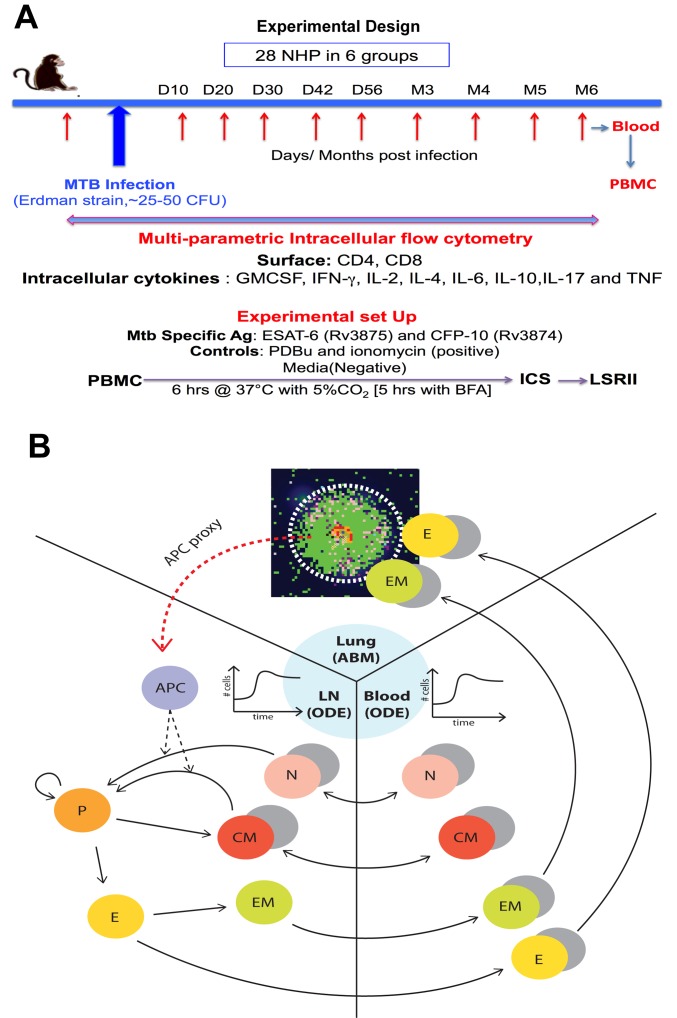
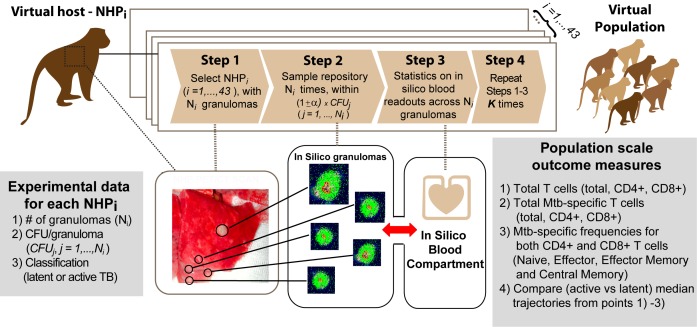
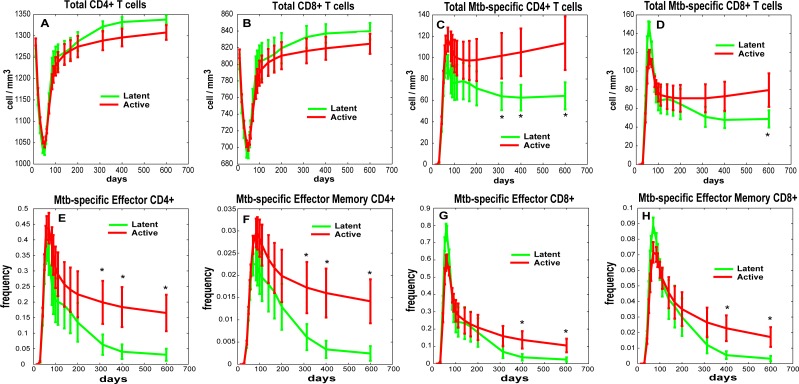
Identifying biomarkers for tuberculosis (TB) is an ongoing challenge in developing immunological correlates of infection outcome and protection. Biomarker discovery is also necessary for aiding design and testing of new treatments and vaccines. To effectively predict biomarkers for infection progression in any disease, including TB, large amounts of experimental data are required to reach statistical power and make accurate predictions. We took a two-pronged approach using both experimental and computational modeling to address this problem. We first collected 200 blood samples over a 2- year period from 28 non-human primates (NHP) infected with a low dose of Mycobacterium tuberculosis. We identified T cells and the cytokines that they were producing (single and multiple) from each sample along with monkey status and infection progression data. Machine learning techniques were used to interrogate the experimental NHP datasets without identifying any potential TB biomarker. In parallel, we used our extensive novel NHP datasets to build and calibrate a multi-organ computational model that combines what is occurring at the site of infection (e.g., lung) at a single granuloma scale with blood level readouts that can be tracked in monkeys and humans. We then generated a large in silico repository of in silico granulomas coupled to lymph node and blood dynamics and developed an in silico tool to scale granuloma level results to a full host scale to identify what best predicts Mycobacterium tuberculosis (Mtb) infection outcomes. The analysis of in silico blood measures identifies Mtb-specific frequencies of effector T cell phenotypes at various time points post infection as promising indicators of infection outcome. We emphasize that pairing wetlab and computational approaches holds great promise to accelerate TB biomarker discovery.


Conflict of interest statement

The authors have declared that no competing interests exist.

Figures

Fig 1
Fig 1. Methodology roadmap.
The left side of the diagram (gray boxes) summarizes all of the datasets generated in this study. We have generated experimental datasets from blood samples and lung necropsies of non-human primates (NHPs), and datasets generated by computational model simulations (in silico data). The right side of the diagram (yellow boxes) represents the analyses performed on each dataset. Each dataset is displayed by a different shape. The blue arrows point to the type of analysis performed on each dataset. The circled numbers represent the chronological order of operations (referred to as steps in the text). Details on which Fig or table in the manuscript contain a dataset or analysis are given in each box.
Fig 2
Fig 2. Experimental design and computational model.
(A) Experimental design for data collection and measurement on the 28 Non-Human Primate. All the datasets are available online as Supporting Information (S2–S6 Tables). (B) Schematic representing the three compartments captured by our computational model. The emphasis is on describing all the lymphocyte phenotypes (both CD4+ and CD8+) tracked during the analysis. The cells populate three different compartments/organs: lung, lymph node and blood. The lung is modeled as an Agent-Based Model (ABM), while the blood and the lymph node are modeled as an Equation-Based Model (EBM), namely as an Ordinary Differential Equation (ODE) system. For most of the phenotypes, both Mtb-specific (colored) and non Mtb-specific (grey) cells are tracked. APC: represented as a proxy in the computational model (see Materials and Methods section and S1 and S2 Texts for details).
Fig 3
Fig 3. Computational model calibration: LUNG.
NHP experimental data on CFU/granuloma (S1 Table) are plotted here versus the in silico datasets of CFU/granuloma (lung compartment) from in silico repository of 10,000 granulomas coupled to the blood and LN dynamics). Although the in silico dataset has time courses up to 600 days, the x-axis always shows a time span of infection up to 200 days to match the NHP blood data. The y-axis represents CFU/granuloma (A-B). (A) In silico dataset of time courses of CFU/granuloma generated in the lung compartment (black circles, with the black solid line representing the median trajectory) compared to experimental data on NHP CFU/granuloma (with the solid red line representing the median, and the dotted red lines representing the min and max values in the NHP data). The median trajectories for both the NHP and in silico data are calculated including the sterilized granulomas, while the min trajectories excluded the sterilized granulomas. (B) Mtb trajectories (total [solid thick], extracellular [solid with empty circles], intracellular [dotted] and non-replicating [solid thin]) in a representative granuloma (containment) compared to the NHP CFU/granuloma experimental data (red circles). (C) Snapshots of 4 different granulomas. The top row of Panel C is for H and E staining of two NHP granulomas. The left granuloma is from NHP 22810, CFU~40. The right granuloma is from NHP 17211, CFU~1240. Both granulomas are ~ 2mm in diameter (see S1 Table for details). The bottom row of Panel C is for in silico granulomas, matching lesion size and CFU/granuloma of the NHP images. Cell types displayed are the following: macrophages (resting-green, activated-blue, infected-orange, chronically infected-red), effector lymphocytes (pro-inflammatory IFN-γ producing T cells-Tγ in pink, cytotoxic T cell-Tc in purple, regulatory T cell-Treg in light blue), extracellular bacteria (olive green), vascular sources (grey and necrotic spots (white)).
Fig 4
Fig 4. Computational model calibration to NHP data from blood.
NHP experimental data on blood T cell phenotypes (S5 Table, T cell dataset) are plotted here versus the in silico datasets of blood T cell phenotypes (blood compartment), from in silico repository of 10,000 granulomas coupled to the blood and LN dynamics. Although the in silico dataset has time courses up to 600 days, the x-axis always shows a time span of infection up to 200 days to match the NHP blood data. The y-axis represents cells/cm3. (A-H) In silico dataset of 10,000 time courses of 8 T cell phenotypes generated in the blood compartment (black solid line [mean] and black dashed lines [5th and 95th percentiles]) compared to experimental data on T cell phenotypes in the blood of Mtb-infected NHPs (red dashed lines with red open circles, representing the min and max). For the minimum and maximum of the NHP data we chose the lowest and highest values at any time point across all the NHPs. In silico predictions are displayed as median (black solid line) and minimum and maximum (dashed black lines). We show Naïve CD4+ ((A) and CD8+ (E)), Central Memory CD4+ (B) and CD8+ (F)), Effector CD4+ (C) and CD8+ (G)) and Effector Memory CD4+ (D) and CD8+ (H). The in silico data have been obtained by summing the respective Mtb-specific and non Mtb-specific equations of the blood compartment of the computational model.
Fig 5
Fig 5. Model validation of in silico Mtb-specific frequencies.
Trajectories over 200 days of T cell frequencies from the computational model against NHP experimental data. The in silico data have been generated following steps illustrated in Fig 6, as well as in the Materials and Methods section. Given the non-zero frequencies in the pre-infection stages, we used initial conditions between 0.01% and 2% for the Mtb-specific Central and Effector memory phenotypes. The red dots represent NHP experimental data, namely the frequencies of T cells producing any of the 6 cytokine measured (IFN-γ, IL-2, IL-6, IL-10, IL-17 and TNF) in response to ESAT-6 and CFP-10 stimulation (see Materials and Methods section for details and S6 Table for the data). Only 9 NHPs data are plotted here. The black solid (mean) and dashed (5th and 95th percentiles) lines represent the trajectories of the in silico data. Panel A: Frequencies of CD4+ T cell Central Memory phenotypes. Panel B: Frequencies of CD4+ T cell Effector Memory phenotypes (Terminally Differentiated and Effector Memory). Panel C: Frequencies of CD8+ T cell Central Memory phenotypes. Panel D: Frequencies of CD4+ T cell Effector Memory phenotypes (Terminally Differentiated and Effector Memory).
Fig 6
Fig 6. Scaling to host methodology.
Experimental data on 43 Mtb-infected NHPs classified as either latent or active TB will be used to guide virtual NHP building process (see Materials and Methods section for further details). Step 1. One NHP out of the 43 (NHPi, i = 1, …,43) is selected and the number of granulomas (Ni) to sample from the in silico repository is determined, together with the CFU per each granuloma (CFUj, j = 1,….,Ni). Step 2. For each CFUj, we select a subset of in silico granulomas from the repository within the range [(1-α)xCFUj, (1+α)xCFUj]. We used α = 10%. The subset is sampled at the time point necropsy for NHPi was performed (see details on S1 Table). Step 3. Statistics on blood readouts are calculated (i.e., mean, median, standard deviation) and stored. Step 4. Steps 1–3 are repeated K times for the same NHPi to mimic the variability and heterogeneity in granuloma outcomes within a single host. The K replications are then stored and host-scale statistics are computed (i.e., mean, median, standard deviation) and combined to simulate trajectories of in silico blood readouts to predict infection outcomes, as shown in Fig 7.
Fig 7
Fig 7. Scaling to host infection outcome predictions for Mtb-specific T cell frequencies.
We built/calibrated virtual NHPs that replicate granuloma heterogeneity and variability in the lung of 43 NHPs (up to 600 days post infection, see S1 Table). Here, in silico blood trajectories of total T cell levels and Mtb-specific T cell frequencies grouped by clinical outcome (as shown in S1 Table) are plotted over 600 days for the same set of virtual NHPs. The in silico data shown here have been generated following steps illustrated in Fig 6, as well as in Materials and Methods section. The two virtual trajectories representing the 43 virtual NHPs are displayed in all the panels as mean +/- 2x(standard error). The asterisks show significant (p<0.05) student t-test between the two trajectories at the same time point. These in silico trajectories have been generated with zero initial conditions for the Mtb-specific T cell memory phenotypes (except for Naïve Mtb-specific T cells, see Materials and Methods section for details). No experimental data is shown here since blood measures are only available for a limited number of NHPs (I.e., 12 out o 43) and only up to 180 days post infection. Panel A: Total CD4+ T cell levels. Panel B: Total CD8+ T cell levels. Panel C: Total Mtb-specific CD4+ T cell levels. Panel D: Total Mtb-specific CD8+ T cell levels. Panels E: Mtb-specific frequencies of Effector CD4+ T cells. Panels F: Mtb-specific frequencies of Effector Memory CD4+ T cells. Panels G: Mtb-specific frequencies of Effector CD8+ T cells. Panels H: Mtb-specific frequencies of Effector Memory CD8+ T cells.

Similar articles

Cited by

References

    1. WHO (2014) Global tuberculosis report 2014. World Health Organization.
    1. O'Garra A, Redford PS, McNab FW, Bloom CI, Wilkinson RJ, et al. (2013) The immune response in tuberculosis. Annu Rev Immunol 31: 475–527. 10.1146/annurev-immunol-032712-095939 - DOI - PubMed
    1. Wallis RS, Kim P, Cole S, Hanna D, Andrade BB, et al. (2013) Tuberculosis biomarkers discovery: developments, needs, and challenges. Lancet Infect Dis 13: 362–372. 10.1016/S1473-3099(13)70034-3 - DOI - PubMed
    1. Walzl G, Ronacher K, Hanekom W, Scriba TJ, Zumla A (2011) Immunological biomarkers of tuberculosis. Nat Rev Immunol 11: 343–354. 10.1038/nri2960 - DOI - PubMed
    1. Whitworth HS, Aranday-Cortes E, Lalvani A (2013) Biomarkers of tuberculosis: a research roadmap. Biomark Med 7: 349–362. 10.2217/bmm.13.53 - DOI - PubMed

Publication types

MeSH terms

LinkOut - more resources