. 2016 Apr 11;12(4):e1004850.
doi: 10.1371/journal.pcbi.1004850. eCollection 2016 Apr.

A Robust Feedforward Model of the Olfactory System

Affiliations

A Robust Feedforward Model of the Olfactory System

Yilun Zhang et al. PLoS Comput Biol. .

Abstract

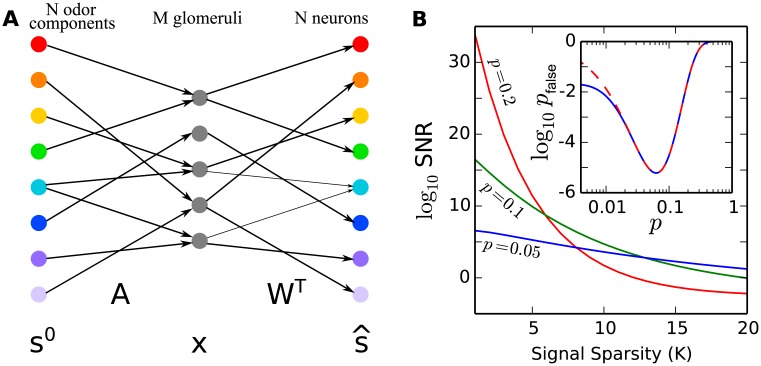
Most natural odors have sparse molecular composition. This makes the principles of compressed sensing potentially relevant to the structure of the olfactory code. Yet, the largely feedforward organization of the olfactory system precludes reconstruction using standard compressed sensing algorithms. To resolve this problem, recent theoretical work has shown that signal reconstruction could take place as a result of a low dimensional dynamical system converging to one of its attractor states. However, the dynamical aspects of optimization slowed down odor recognition and were also found to be susceptible to noise. Here we describe a feedforward model of the olfactory system that achieves both strong compression and fast reconstruction that is also robust to noise. A key feature of the proposed model is a specific relationship between how odors are represented at the glomeruli stage, which corresponds to a compression, and the connections from glomeruli to third-order neurons (neurons in the olfactory cortex of vertebrates or Kenyon cells in the mushroom body of insects), which in the model corresponds to reconstruction. We show that should this specific relationship hold true, the reconstruction will be both fast and robust to noise, and in particular to the false activation of glomeruli. The predicted connectivity rate from glomeruli to third-order neurons can be tested experimentally.


Conflict of interest statement

The authors have declared that no competing interests exist.

Figures

Fig 1
Fig 1
(A) Illustration of the model structure. An odor is represented by a sparse binary vector s0 of its mono-molecular components. This signal is compressed into the activities of M glomeruli represented by a binary vector x through a binary measurement matrix A. The signal is then recovered as the activities of N neurons in the mushroom body or olfactory cortex represented by a binary vector s^ through another matrix WT. (B) The signal-to-noise ratio (SNR) as a function of signal sparsity K where N = 10000 and M = 500. For a given K, there is a optimal connectivity rate p = pm that maximizes SNR. At the same time, even for a system optimized to a given K, decreasing K still increases SNR. Inset: false detection rate pfalse as a function of average connectivity p; M = 500 and K = 15 are chosen for this illustration. Solid line is exact formula, while dashed line is the approximation using Eq 10. We can see that Eq 10 is a very good approximation to the exact formula when p is not too small.
Fig 2
Fig 2. Signal-To-Noise-Ratio (SNR) of the recovered signal in our model.
N = 10000 is used. (A) SNR as a function of K and M. Black is shown for SNR > 106. The blue line shows SNR = 1, and the red line shows SNR = K, i.e. one error occurs on average. (B) Optimal SNR as a function of M. (C) Optimal SNR as a function of K. (D) Number of glomeruli required to reach threshold SNR when optimal connectivity rate is used.
Fig 3
Fig 3. Demonstration of the accuracy-robustness trade-off.
N = 10000, K = 15, M = 1000 and the optimal connectivity rate are used. (A) pfalse and SNR for different activation thresholds at the reconstruction stage. With lower recovery thresholds, the robustness of the system to recovery noise increases, while the false detection rate increases, and the SNR of recovered signal decreases. (B) An example of the recovered signal with different recovery thresholds. True signal is shown in big colored dots, while the reconstruction error is represented by small colored dots. As we lower the threshold, the recovered signal becomes noisier.
Fig 4
Fig 4. Comparison of the performance of feedforward architecture with that of LASSO.
For this example, we chose N = 1000 and M = 500. Linear measurement is used for LASSO. Feedforward architecture performs well when the signal is very sparse, while LASSO has lower reconstruction error as K increases, at the price of increasingly more iterations. On the other hand, if we constrain the number of iterations, LASSO still performs better when K is large, but significantly worse with very sparse signals.

Similar articles

Cited by

References

    1. Gilbert AN. What the nose knows: the science of scent in everyday life. Crown Publishers New York; 2008.
    1. Hummel T, Welge-Lüssen A. Taste and smell: An update. vol. 63. Karger Medical and Scientific Publishers; 2006.
    1. Kandel ER, Schwartz JH, Jessell TM, Siegelbaum SA, Hudspeth A. Principles of neural science; 2014.
    1. Candes EJ, Tao T. Decoding by linear programming. Information Theory, IEEE Transactions on. 2005;51(12):4203–4215. 10.1109/TIT.2005.858979 - DOI
    1. Tootoonian S, Lengyel M. A Dual Algorithm for Olfactory Computation in the Locust Brain In: Advances in Neural Information Processing Systems; 2014. p. 2276–2284.

Publication types

Substances

LinkOut - more resources