. 2015 Mar 10;48(5):1598-1605.
doi: 10.1021/ma502518p. Epub 2015 Feb 23.

Influence of the Solvent Quality on Ring Polymer Dimensions

Affiliations

Influence of the Solvent Quality on Ring Polymer Dimensions

Sebastian Gooßen et al. Macromolecules. .

Abstract

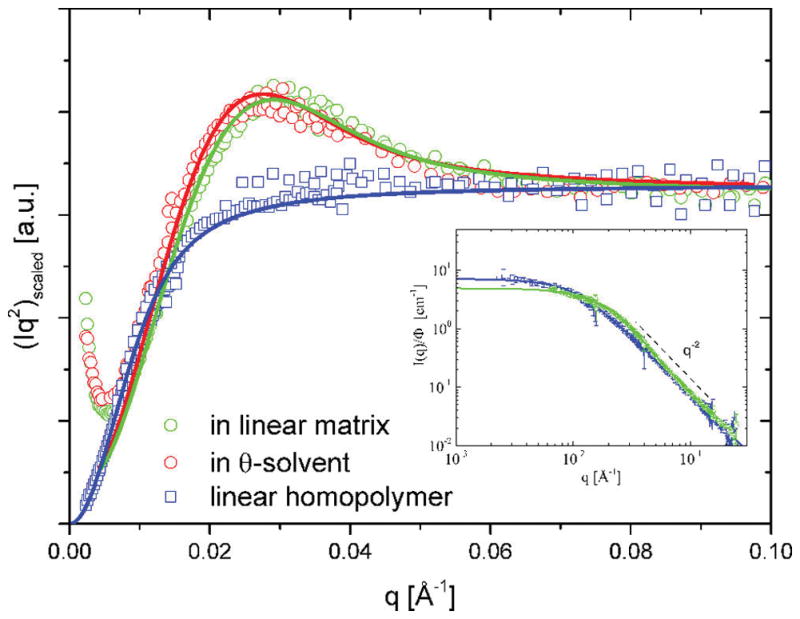
We present a systematic investigation of well-characterized, experimentally pure polystyrene (PS) rings with molar mass of 161 000 g/mol in dilute solutions. We measure the ring form factor at θ- and good-solvent conditions as well as in a polymeric solvent (linear PS of roughly comparable molar mass) by means of small-angle neutron scattering (SANS). Additional dynamic light scattering (DLS) measurements support the SANS data and help elucidate the role of solvent quality and solution preparation. The results indicate the increase of ring dimensions as the solvent quality improves. Furthermore, the experimental form factors in both θ-solvent and linear matrix behave as ideal rings and are fully superimposable. The nearly Gaussian conformations of rings in a melt of linear chains provide evidence of threading of linear chains through rings. The latter result has implications for the dynamics of ring-linear polymer mixtures.


Conflict of interest statement

Notes

The authors declare no competing financial interest.

Figures

Figure 1
Figure 1
Second virial coefficient of R14 in d12-cyclohexane as a function of temperature, obtained from SANS. The average extrapolated θ-temperature is about 35 ± 1 °C. The maximum width of uncertainty is determined from the error bars to be about ±3 °C.
Figure 2
Figure 2
Scattering functions and representative slopes for the overall and internal structure of ring polymers in various solvents at different length scales. The linear polymeric matrix in the ring/linear blend is congruent with the θ-solvent.
Figure 3
Figure 3
Kratky plot of rings dissolved in different solvents. Inset: a characteristic peak in either solvent is prominent in generalized Kratky plots with scaled ordinate axes Iq1/ν. Solid lines are best fits to the data using eq 4. Dashed lines represent the limiting slopes of I(q) vs q curves of Figure 2. The upturn at the lowest q is due to the parasitic scattering. Its contribution was computed as AqB. Dashed line is the form factor calculation without considering the latter.
Figure 4
Figure 4
(a) Intermediate light scattering function for a ring PS R161 solution in d8-toluene (0.5 wt %) at 33 °C. Data are shown for the lowest and highest scattering angles, 30° (circles) and 150° (squares). The respective distributions of relaxation times obtained from CONTIN analysis are also shown. Inset: the q-dependence of the extracted characteristic relaxation rate. (b) Intermediate light scattering function for the same R161 solution in d12-cyclohexane (0.012 wt %) and different temperatures and scattering angles, indicated in the plot: 33 °C and 30° (open squares); 40 °C and 30° (bold circles); 50 °C and 30° (open stars). The respective distributions of relaxation times obtained from CONTIN analysis are also shown. Insets: (top) Respective q-dependent characteristic relaxation rates at 40 and 50 °C. The slow mode 40 °C is depicted by bold triangles. (bottom) Intermediate light scattering function for a linear PS (250 000 g/mol) solution in d8-toluene (0.024 wt %) at a scattering angle of 150° and two temperatures, 25 °C (bold symbols) and 50 °C (open symbols).
Figure 5
Figure 5
Comparison of the experimental ring form factor in θ- solvent and in a comparable linear matrix. Intensities were normalized to the same concentrations and rescaled to overlap at high scattering vectors. Symbols are explained in the figure legend. Solid lines are best fit curves to the ideal Gaussian ring form factor. A small difference in the radius of gyration, i.e., 72 to 76 Å, can be noticed from the peak positions. For further comparison also the form factor of the linear matrix chain which is a perfect random walk Debye chain is included. The inset shows the direct intensity comparison (I vs q) for latter ideal linear chain blend and the ring–linear blend.

References

    1. Meaburn KJ, Misteli T. Nature. 2007;445:379. - PubMed
    1. Jun S, Mulder B. Proc Natl Acad Sci U S A. 2006;103:12388. - PMC - PubMed
    1. Cremer T, Cremer M, Dietzel S, Müller S, Solovei I, Fakan S. Curr Opin Cell Biol. 2006;18:307. - PubMed
    1. Chisholm MH, Gallucci JC, Yin H. Proc Natl Acad Sci U S A. 2006;103:15315. - PMC - PubMed
    1. Kapnistos M, Lang M, Vlassopoulos D, Pyckhout-Hintzen W, Richter D, Cho D, Chang T, Rubinstein M. Nat Mater. 2008;7:997. - PMC - PubMed

LinkOut - more resources