. 2016 Mar 31:10:96.
doi: 10.3389/fnins.2016.00096. eCollection 2016.

A Model of Blood Pressure, Heart Rate, and Vaso-Vagal Responses Produced by Vestibulo-Sympathetic Activation

Affiliations

A Model of Blood Pressure, Heart Rate, and Vaso-Vagal Responses Produced by Vestibulo-Sympathetic Activation

Theodore Raphan et al. Front Neurosci. .

Abstract

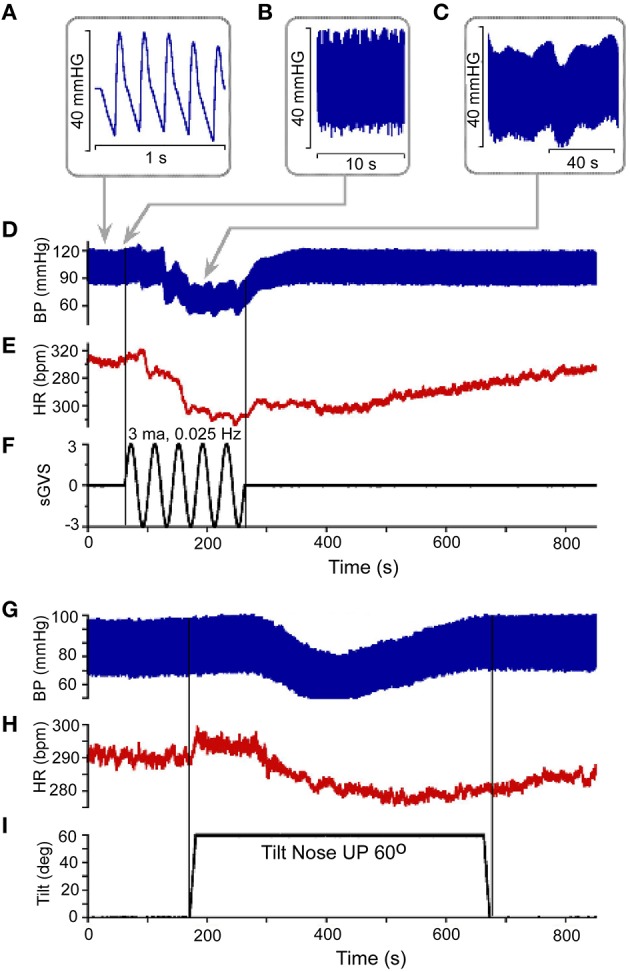
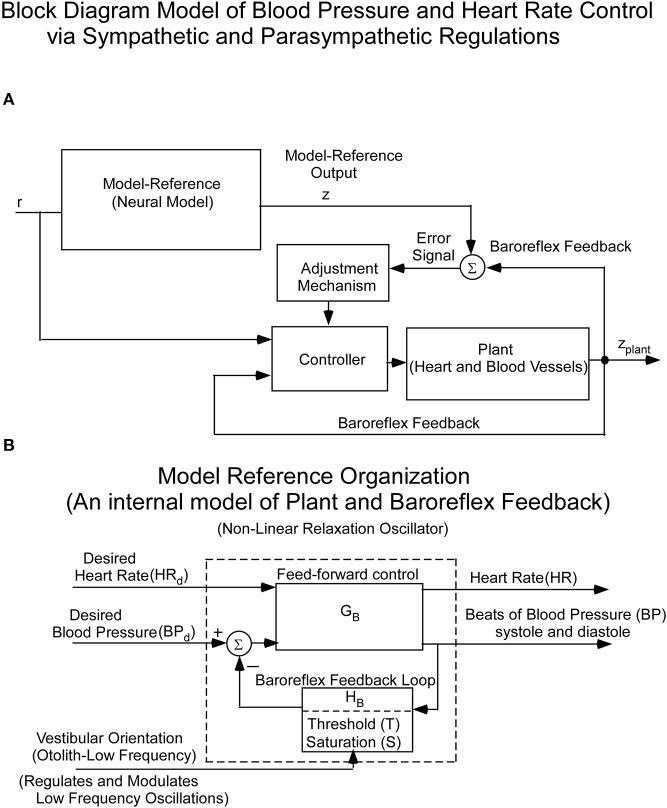
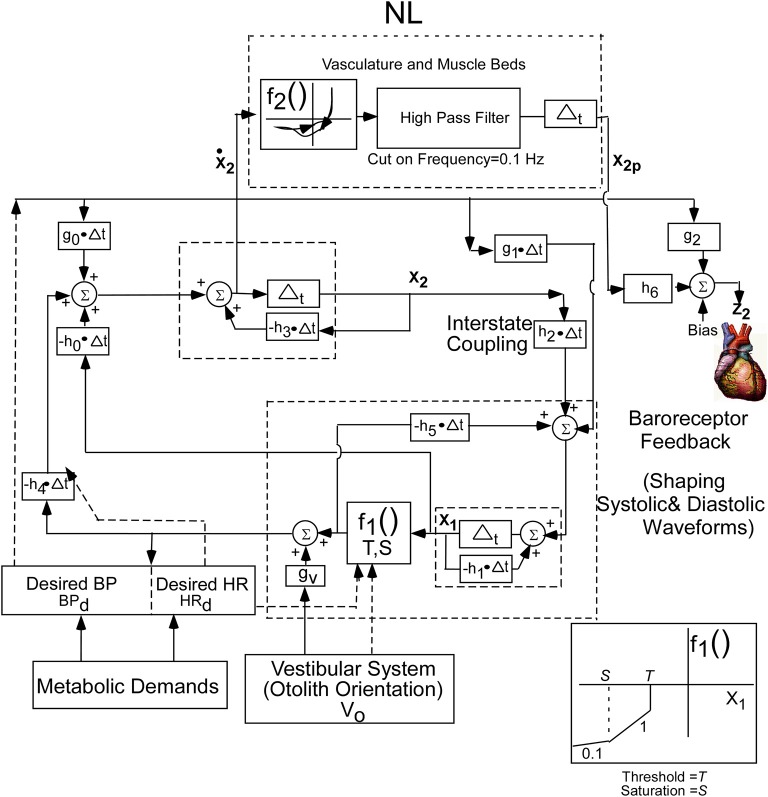
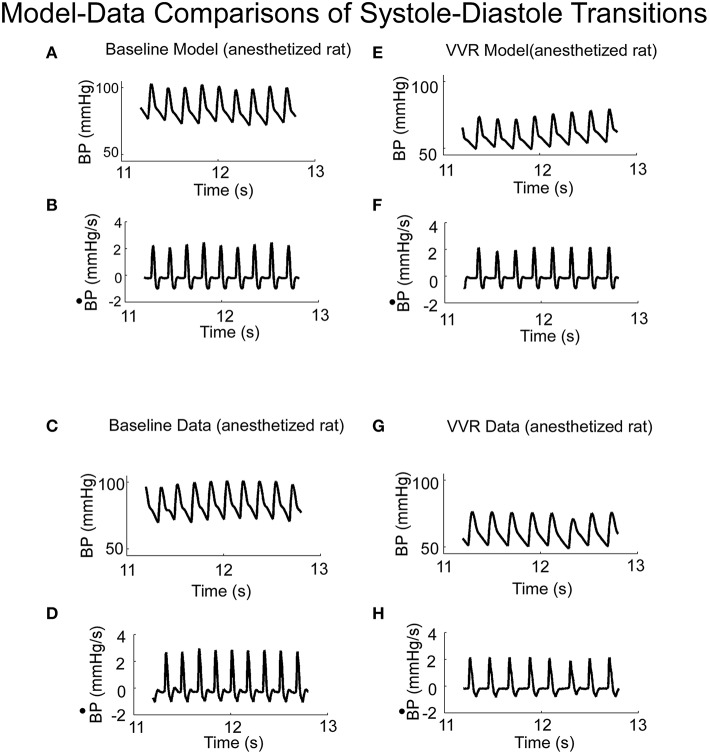
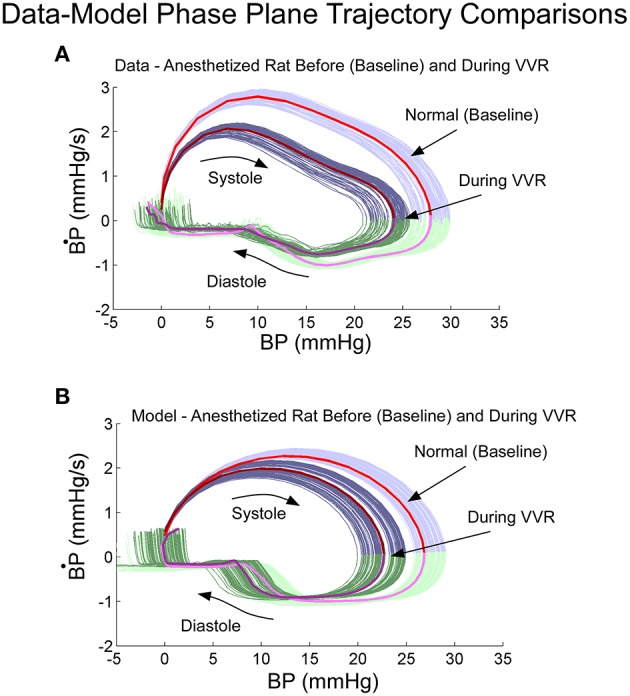
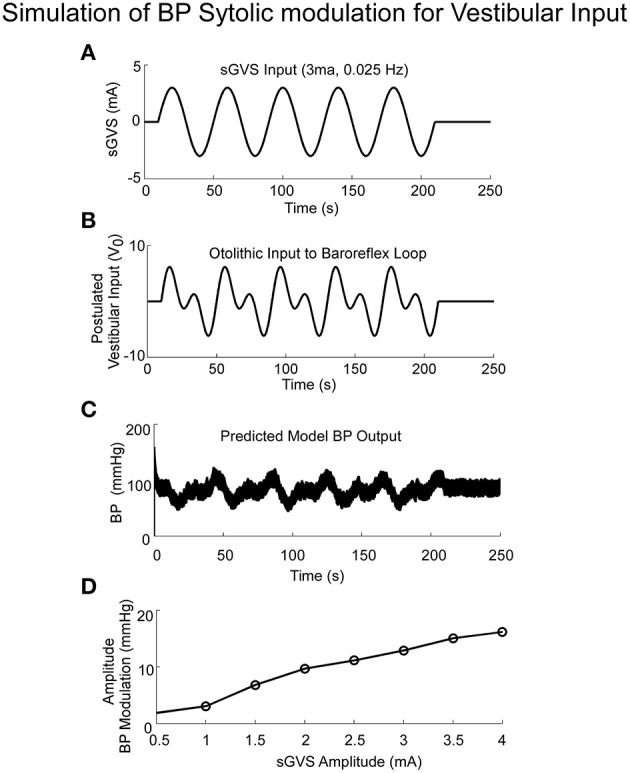
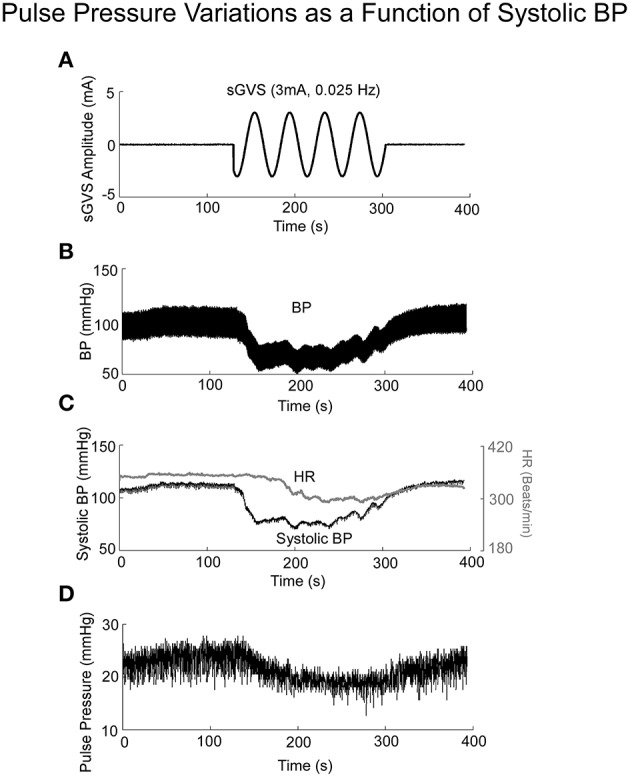
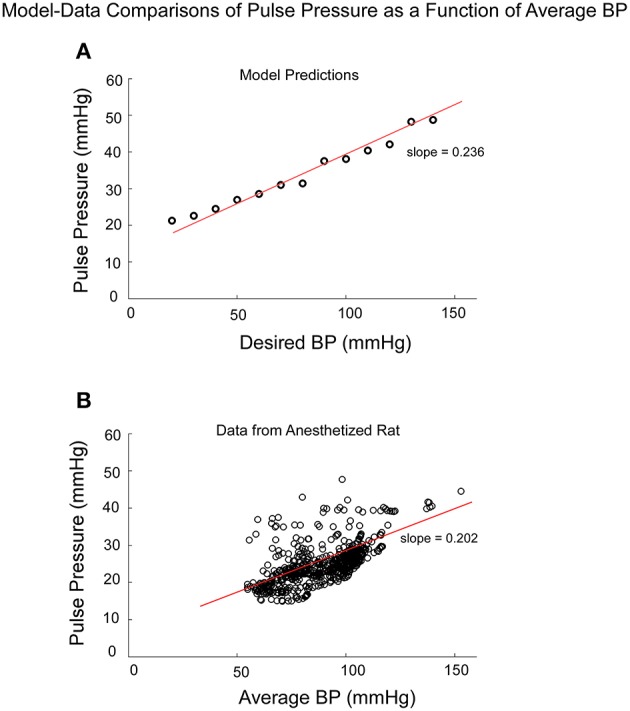
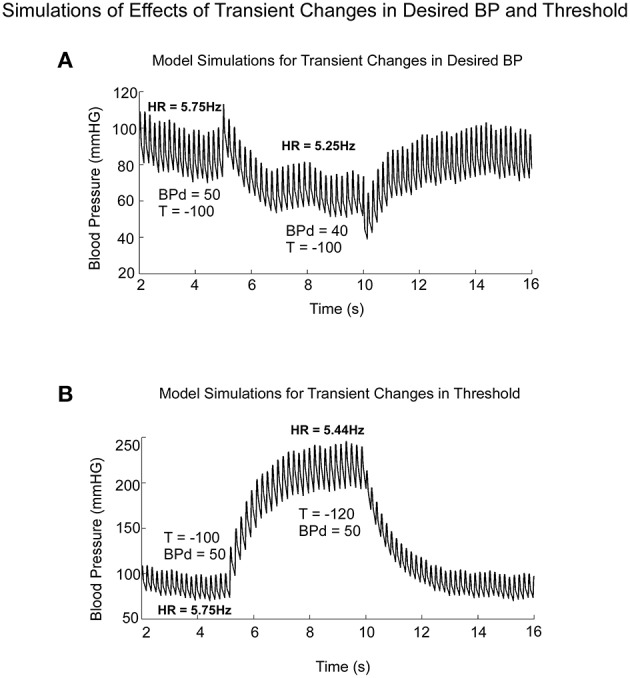
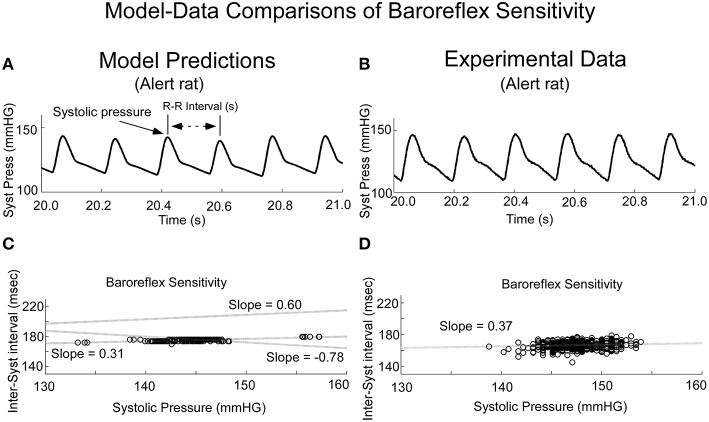
Blood Pressure (BP), comprised of recurrent systoles and diastoles, is controlled by central mechanisms to maintain blood flow. Periodic behavior of BP was modeled to study how peak amplitudes and frequencies of the systoles are modulated by vestibular activation. The model was implemented as a relaxation oscillator, driven by a central signal related to Desired BP. Relaxation oscillations were maintained by a second order system comprising two integrators and a threshold element in the feedback loop. The output signal related to BP was generated as a nonlinear function of the derivative of the first state variable, which is a summation of an input related to Desired BP, feedback from the states, and an input from the vestibular system into one of the feedback loops. This nonlinear function was structured to best simulate the shapes of systoles and diastoles, the relationship between BP and Heart Rate (HR) as well as the amplitude modulations of BP and Pulse Pressure. Increases in threshold in one of the feedback loops produced lower frequencies of HR, but generated large pulse pressures to maintain orthostasis, without generating a VasoVagal Response (VVR). Pulse pressures were considerably smaller in the anesthetized rats than during the simulations, but simulated pulse pressures were lowered by including saturation in the feedback loop. Stochastic changes in threshold maintained the compensatory Baroreflex Sensitivity. Sudden decreases in Desired BP elicited non-compensatory VVRs with smaller pulse pressures, consistent with experimental data. The model suggests that the Vestibular Sympathetic Reflex (VSR) modulates BP and HR of an oscillating system by manipulating parameters of the baroreflex feedback and the signals that maintain the oscillations. It also shows that a VVR is generated when the vestibular input triggers a marked reduction in Desired BP.

Keywords: baroreflex; modeling and simulations; pulse pressure; rat; relaxation oscillator; vasovagal syncope.


Figures

Figure 1
Figure 1
(A) Resting Blood Pressure response (BP) over 1 s time scale showing the triangular shapes of diastolic to systolic transitions. (B,C) BP variations over 10 s (B) and 40 s (C) scale. Vasovagal Response in BP (D) and HR (E) in response to ± 3 mA 0.025 Hz sinusoidal Galvanic Vestibular Stimulation (sGVS). This stimulus (F) generated a VVR, which is characterized by a transient decline in BP (D) followed by a decline in HR (E). The two vertical lines represent the start and stop of stimulation, respectively. The low level of HR outlasted the low level of BP (D,E). There was also a transient drop in BP (G) and HR (H) in response to nose up tilt of 60° (I). The tilt up and back are shown by the two vertical lines, respectively. The transient drops in BP are generally slower than during sGVS, but the recovery follows a similar time course where HR rises to baseline values slower than BP (G,H).
Figure 2
Figure 2
(A) Block diagram of the hypothesized Model Reference Adaptive Control (MRAC) of BP and HR. The input (r) is a constant input to the Neural Reference Model, which is an internal model of the dynamics of the heart blood vessels (plant), and baroreflex feedback. The output of this internal model reference is z. The model output (z) is compared with the plant (Heart and Blood Vessel) output via feedback sensors (Baroreflex). The error drives an adjustment mechanism for the controller that drives the heart and blood vessels (Plant). (B) Organization of the Neural Model Reference, which is an internal model of an oscillator that controls the beating heart and blood pressure oscillations. The oscillations of the internal model are controlled by Desired Blood Pressure, Desired Heart Rate, and vestibular (otolith) input.
Figure 3
Figure 3
Realization of the internal reference model as a second order relaxation oscillator. Equations that implement the model were used to simulate BP and HR. The model parameters were chosen as:h0 = −40.0, h1 = 19.5, h2 = 35.6, h3 = 46.15, h4 = 140, h5 = −61.4, h6 = −0.05, bias = 30, g0 = −88.05, g1 = −18.5, g2 = 0.9, g3 = 0.1, S = −700, T = −40. The nonlinear function, NL, operated on the derivative of x2 to generate the output reference signal for controlling the vasculature that controls BP. See text for model equations and detailed description.
Figure 4
Figure 4
(A) Model predictions of systoles and diastoles during baseline BP. (B) Model predictions of the derivative of BP (BP). (C,D) Corresponding baseline experimental data of BP and its derivative, BP, measured in anesthetized rat. Model predictions of systoles and diastoles of BP (E), and its derivative, BP (F), during a VVR. Note that with the NL function, the model predicted the average BP, systoles and diastoles acurately. (G,H) Corresponding baseline experimental data of BP and its derivative, BP, measured in an anesthetized rat.
Figure 5
Figure 5
Phase plane trajectory (B·P vs. BP) for experimental data (A) and model predictions (B). The shape of the predicted model trajectory accurately predicted the data both before and after a VVR. See text for explication.
Figure 6
Figure 6
Simulations of systolic BP modulation due to sGVS (A). The central otolithic signal that inputs to the baroreflex was assumed to have a second harmonic component (B). (C)The model-predicted systolic modulation contains this strong second harmonic in accordance with the data. (D) The amplitude of systolic and diastolic modulations as a function of vestibular input.
Figure 7
Figure 7
BP, HR, and Pulse Pressure in response to 3 mA, 0.025 Hz sGVS. (A) sGVS stimulus. (B) BP response showing a VVR and oscillations in response to sGVS. (C) Systolic BP as a function of time, before, during, and after sGVS. BP transiently fell, was sustained during stimulation and then rose back to steady state level. HR also fell, but not synchronously with BP. (D) Pulse pressure averaged over 25 s interval rose and fell in synchrony with BP.
Figure 8
Figure 8
Comparison of model predictions of Pulse Pressure vs. Desired BP (BPd) and data of Pulse Pressure vs. Average BP from an anesthetized rat. Average BP was assumed to be an estimate of Desired BP (A) The model predictions of Pulse Pressure were approximately linearly related to Desired BP as pule pressure ranged from 20 to 50 mmHG. Pusle Pressure then saturated due to the saturation representing the baroreflex feedback. (B) The experimental data also had an approximate linear increase as a function of Average BP. The available data were obtained for Average BP ranging from 50 to 120 mmHG. Data points at 140 and 160 mmHG Average BP also followed this linear trend.
Figure 9
Figure 9
Model predictions of the differential effects on the systolic to diastolic transitions as a function of time due to transient changes in Desired PB and Threshold (T). (A) Changes in Desired BP simulated the anticompensatory behavior of BP and HR during a VVR with drops in BP, Systolic BP, Pulse Pressure, and HR. (B) Changes in Threshold generate drops in HR, with increases in time between systoles (R-R interval). During the transient change in Threshold, there were large increases in Systolic BP and pulse pressure, not consistent with a VVR.
Figure 10
Figure 10
Comparisons of model predicted Baroreflex Sensitivity with that derived from experimental data. (A) The model predicted variations in frequency of systoles, the inverse of HR. (B) Experimental data in alert rats also had this variation in frequency of systoles. (C) The model simulated Baroreflex Sensitivity by varying the threshold, but by altering the level of the vestibular input, the slope could be changed (dotted lines with varying slopes). (D) The Baroreflex Sensitivity in the alert rat also had a positive slope, which was similar to that of the model prediction with no vestibular input. This slope was somewhat greater than the slope for the anesthetized rat, which was close to zero.

References

    1. Anastasio T. J. (1991). Neural networkmodels of velocity storage in the horizontal vestibulo-ocular reflex. Biol. Cybern. 64, 187–196. 10.1007/BF00201979 - DOI - PubMed
    1. Anastasio T. J., Robinson D. A. (1989). The distributed representation of vestibulo-oculomotor signals by brain-stem neurons. Biol. Cybern. 61, 79–88. 10.1007/BF00204592 - DOI - PubMed
    1. Balaban C. D. (1996). Vestibular nucleus projections to the parabrachial nucleus in rabbits: implications for vestibular influences on the autonomic nervous system. Exp. Brain Res. 108, 367–381. 10.1007/BF00227260 - DOI - PubMed
    1. Balaban C. D., McGee D. M., Zhou J., Scudder C. A. (2002). Responses of primate caudal parabrachial nucleus and Kolliker-fuse nucleus neurons to whole body rotation. J. Neurophysiol. 88, 3175–3193. 10.1152/jn.00499.2002 - DOI - PubMed
    1. Barkhausen H. (1935). Lehrbuch der Elektronen-Rohren und Ihrer Technichen Anwendungen [Textbook of Electron Tubes and Their Technical Applications] (in German). Leipzig: S. Hirzel.

LinkOut - more resources