

Vestibular Compensation in Unilateral Patients Often Causes Both Gain and Time Constant Asymmetries in the VOR
- PMID: 27065839
- PMCID: PMC4809898
- DOI: 10.3389/fncom.2016.00026
Vestibular Compensation in Unilateral Patients Often Causes Both Gain and Time Constant Asymmetries in the VOR
Abstract
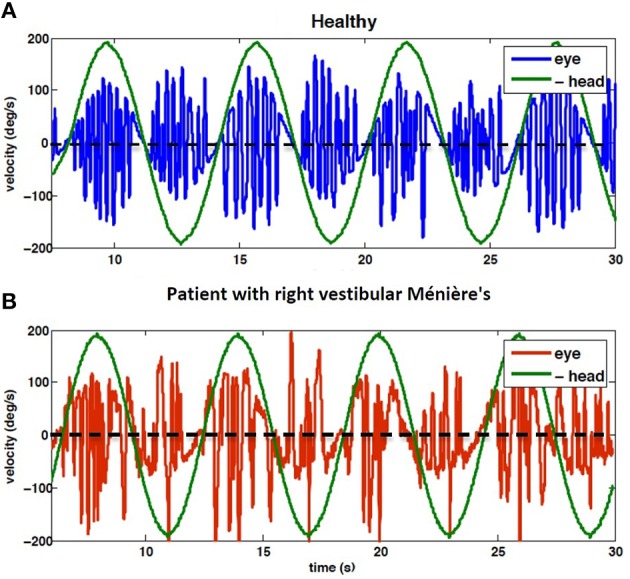
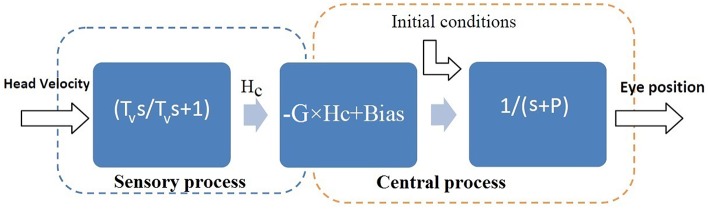
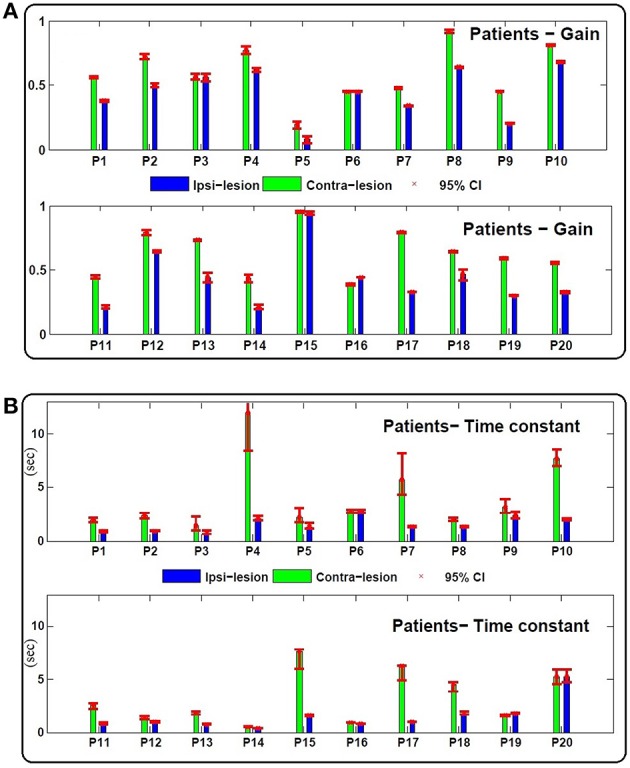
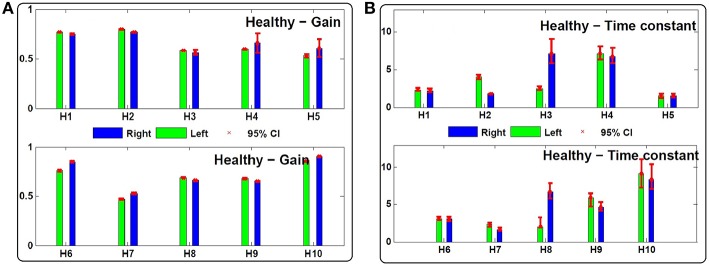
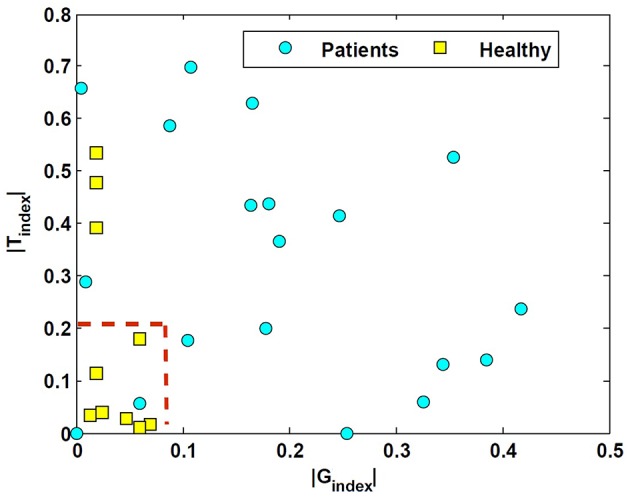
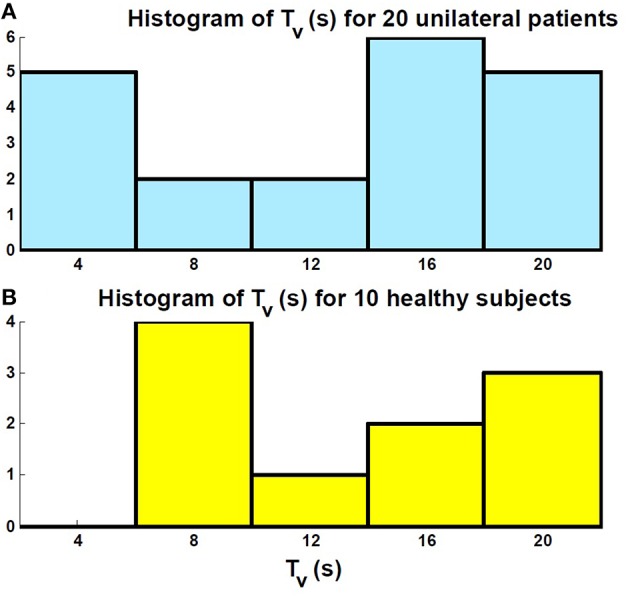
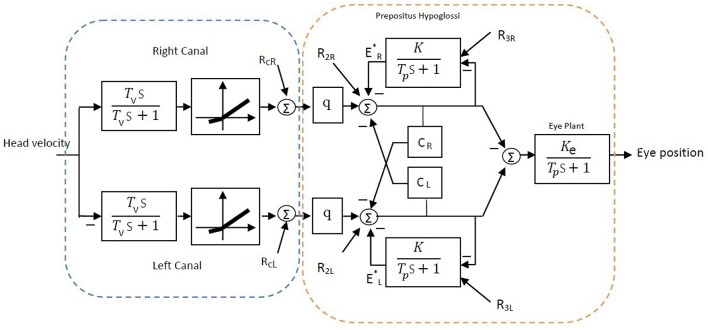
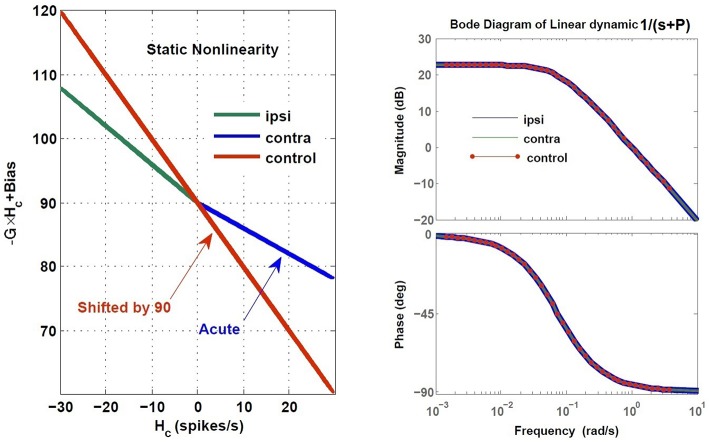
The vestibulo-ocular reflex (VOR) is essential in our daily life to stabilize retinal images during head movements. Balanced vestibular functionality secures optimal reflex performance which otherwise can be distorted by peripheral vestibular lesions. Luckily, vestibular compensation in different neuronal sites restores VOR function to some extent over time. Studying vestibular compensation gives insight into the possible mechanisms for plasticity in the brain. In this work, novel experimental analysis tools are employed to reevaluate the VOR characteristics following unilateral vestibular lesions and compensation. Our results suggest that following vestibular lesions, asymmetric performance of the VOR is not only limited to its gain. Vestibular compensation also causes asymmetric dynamics, i.e., different time constants for the VOR during leftward or rightward passive head rotation. Potential mechanisms for these experimental observations are provided using simulation studies.
Keywords: commissural neuron circuitry; plasticity; unilateral vestibular lesion; vestibular compensation; vestibulo-ocular reflex.
Figures
Similar articles
-
Modelling non-linearities in the vestibulo-ocular reflex (VOR) after unilateral or bilateral loss of peripheral vestibular function.Exp Brain Res. 2001 Apr;137(3-4):369-86. doi: 10.1007/s002210000667. Exp Brain Res. 2001. PMID: 11355383 Clinical Trial.
-
Recovery of vestibulo-ocular reflex-function in subjects with an acute unilateral peripheral vestibular deficit.J Vestib Res. 1999;9(2):135-44. J Vestib Res. 1999. PMID: 10378185
-
Vestibular compensation in the horizontal vestibulo-ocular reflex of the goldfish.Behav Brain Res. 1996 Feb;75(1-2):127-37. doi: 10.1016/0166-4328(96)00180-5. Behav Brain Res. 1996. PMID: 8800649
-
Acute unilateral loss of vestibular function.Handb Clin Neurol. 2016;137:219-29. doi: 10.1016/B978-0-444-63437-5.00015-7. Handb Clin Neurol. 2016. PMID: 27638073 Review.
-
Plasticity in the vestibulo-ocular and optokinetic reflexes following modification of canal input.Rev Oculomot Res. 1985;1:145-53. Rev Oculomot Res. 1985. PMID: 3940026 Review.
Cited by
-
Identification of Follow-Up Markers for Rehabilitation Management in Patients with Vestibular Schwannoma.J Clin Med. 2023 Sep 13;12(18):5947. doi: 10.3390/jcm12185947. J Clin Med. 2023. PMID: 37762888 Free PMC article.
-
Unusual Vestibulo-Ocular Reflex Responses in Patients With Peripheral Vestibular Disorders Detected by the Caloric Step Stimulus Test.Front Neurol. 2020 Nov 30;11:597562. doi: 10.3389/fneur.2020.597562. eCollection 2020. Front Neurol. 2020. PMID: 33329351 Free PMC article.
-
Measure of Central Vestibular Compensation: A Review.J Int Adv Otol. 2022 Sep;18(5):441-446. doi: 10.5152/iao.2022.21207. J Int Adv Otol. 2022. PMID: 35971266 Free PMC article. Review.
-
Long-Term Evolution of Vestibular Compensation, Postural Control, and Perceived Disability in a Population of Patients with Vestibular Neuritis.J Clin Med. 2022 Jul 6;11(14):3941. doi: 10.3390/jcm11143941. J Clin Med. 2022. PMID: 35887704 Free PMC article.
-
Vestibulo-Ocular Reflex Stabilization after Vestibular Schwannoma Surgery: A Story Told by Saccades.Front Neurol. 2017 Jan 25;8:15. doi: 10.3389/fneur.2017.00015. eCollection 2017. Front Neurol. 2017. PMID: 28179894 Free PMC article.
References
LinkOut - more resources
Full Text Sources
Other Literature Sources