

Children with well controlled epilepsy possess different spatio-temporal patterns of causal network connectivity during a visual working memory task
- PMID: 27066148
- PMCID: PMC4805687
- DOI: 10.1007/s11571-015-9373-x
Children with well controlled epilepsy possess different spatio-temporal patterns of causal network connectivity during a visual working memory task
Abstract
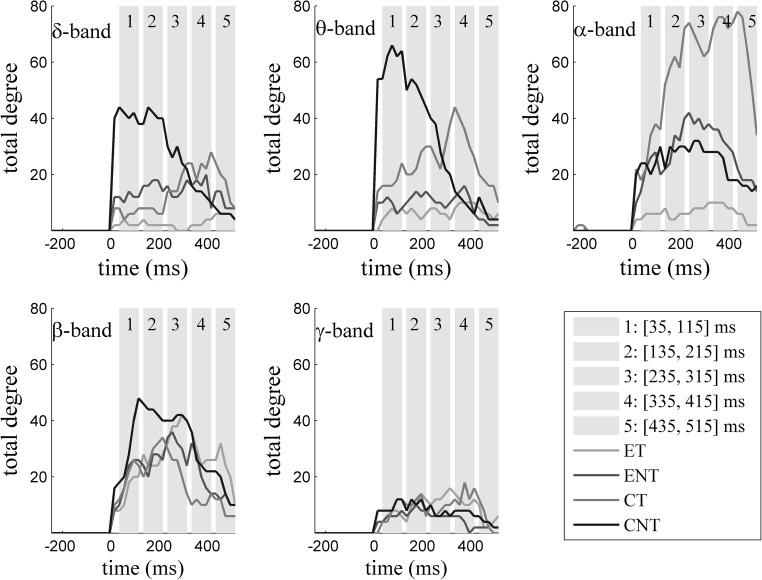
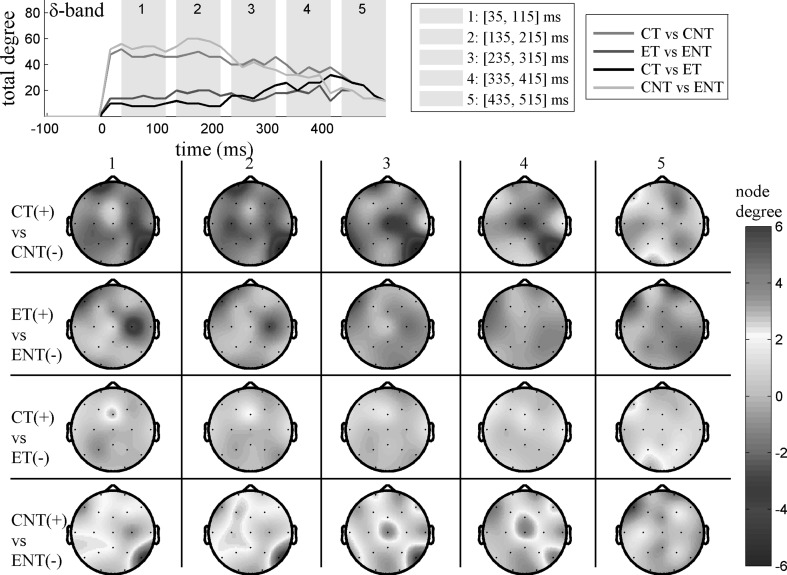
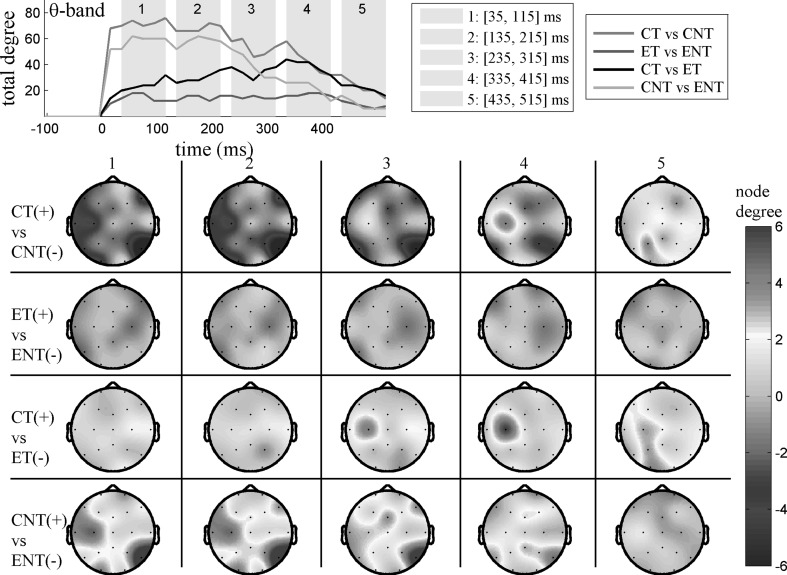
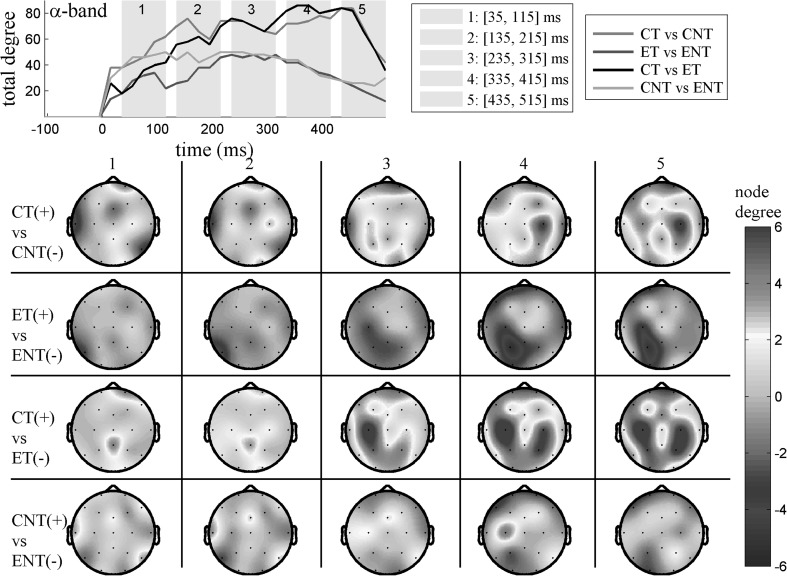
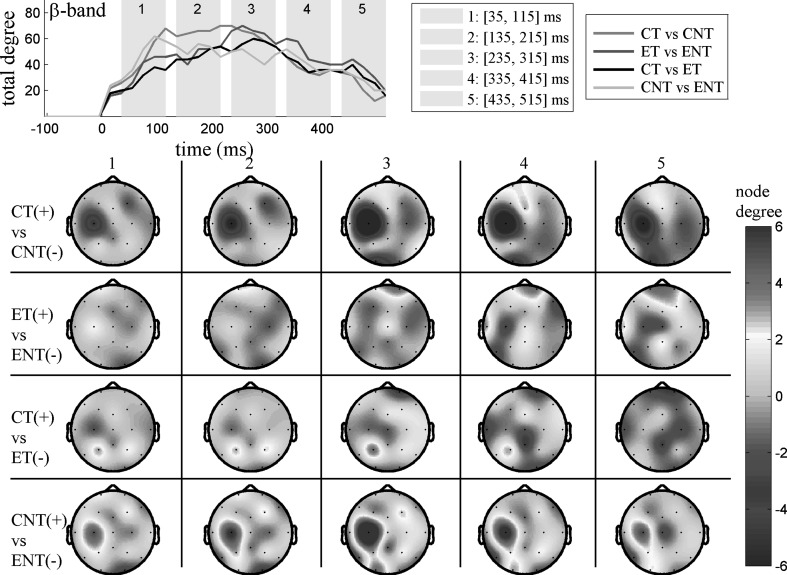
Using spectral Granger causality (GC) we identified distinct spatio-temporal causal connectivity (CC) patterns in groups of control and epileptic children during the execution of a one-back matching visual discrimination working memory task. Differences between control and epileptic groups were determined for both GO and NOGO conditions. The analysis was performed on a set of 19-channel EEG cortical activity signals. We show that for the GO task, the highest brain activity in terms of the density of the CC networks is observed in α band for the control group while for the epileptic group the CC network seems disrupted as reflected by the small number of connections. For the NOGO task, the denser CC network was observed in θ band for the control group while widespread differences between the control and the epileptic group were located bilaterally at the left temporal-midline and parietal areas. In order to test the discriminative power of our analysis, we performed a pattern analysis approach based on fuzzy classification techniques. The performance of the classification scheme was evaluated using permutation tests. The analysis demonstrated that, on average, 87.6 % of the subjects were correctly classified in control and epileptic. Thus, our findings may provide a helpful insight on the mechanisms pertaining to the cognitive response of children with well controlled epilepsy and could potentially serve as "functional" biomarkers for early diagnosis.
Keywords: Causal connectivity networks; Children; Classification; EEG; Early diagnosis; Epilepsy; Spectral Granger causality; Working memory.
Figures
Similar articles
-
Functional localization and effective connectivity of cortical theta and alpha oscillatory activity during an attention task.Clin Neurophysiol Pract. 2017 Oct 14;2:193-200. doi: 10.1016/j.cnp.2017.09.002. eCollection 2017. Clin Neurophysiol Pract. 2017. PMID: 30214995 Free PMC article.
-
Granger causality analysis reveals distinct spatio-temporal connectivity patterns in motor and perceptual visuo-spatial working memory.Front Comput Neurosci. 2014 Nov 13;8:146. doi: 10.3389/fncom.2014.00146. eCollection 2014. Front Comput Neurosci. 2014. PMID: 25431557 Free PMC article.
-
EEG Cortical Connectivity Analysis of Working Memory Reveals Topological Reorganization in Theta and Alpha Bands.Front Hum Neurosci. 2017 May 12;11:237. doi: 10.3389/fnhum.2017.00237. eCollection 2017. Front Hum Neurosci. 2017. PMID: 28553215 Free PMC article.
-
What graph theory actually tells us about resting state interictal MEG epileptic activity.Neuroimage Clin. 2015 May 23;8:503-15. doi: 10.1016/j.nicl.2015.05.008. eCollection 2015. Neuroimage Clin. 2015. PMID: 26106575 Free PMC article.
-
The Role of EEG-fMRI in Studying Cognitive Network Alterations in Epilepsy.Front Neurol. 2019 Sep 24;10:1033. doi: 10.3389/fneur.2019.01033. eCollection 2019. Front Neurol. 2019. PMID: 31608007 Free PMC article. Review.
Cited by
-
Altered Functional and Causal Connectivity of Cerebello-Cortical Circuits between Multiple System Atrophy (Parkinsonian Type) and Parkinson's Disease.Front Aging Neurosci. 2017 Aug 10;9:266. doi: 10.3389/fnagi.2017.00266. eCollection 2017. Front Aging Neurosci. 2017. PMID: 28848423 Free PMC article.
-
Prediction of epilepsy seizure from multi-channel electroencephalogram by effective connectivity analysis using Granger causality and directed transfer function methods.Cogn Neurodyn. 2019 Oct;13(5):461-473. doi: 10.1007/s11571-019-09534-z. Epub 2019 May 8. Cogn Neurodyn. 2019. PMID: 31565091 Free PMC article.
-
Hybrid machine learning method for a connectivity-based epilepsy diagnosis with resting-state EEG.Med Biol Eng Comput. 2022 Jun;60(6):1675-1689. doi: 10.1007/s11517-022-02560-w. Epub 2022 Apr 18. Med Biol Eng Comput. 2022. PMID: 35435566
-
Construction of functional brain connectivity networks from fMRI data with driving and modulatory inputs: an extended conditional Granger causality approach.AIMS Neurosci. 2020 Apr 10;7(2):66-88. doi: 10.3934/Neuroscience.2020005. eCollection 2020. AIMS Neurosci. 2020. PMID: 32607412 Free PMC article.
-
Transition of brain networks from an interictal to a preictal state preceding a seizure revealed by scalp EEG network analysis.Cogn Neurodyn. 2019 Apr;13(2):175-181. doi: 10.1007/s11571-018-09517-6. Epub 2019 Jan 2. Cogn Neurodyn. 2019. PMID: 30956721 Free PMC article.
References
-
- Astolfi L, Cincotti F, Mattia D, Marciani MG, Baccala LA, Fallani FD, Salinari S, Ursino M, Zavaglia M, Ding L, Edgar JC, Miller GA, He B, Babiloni F. Comparison of different cortical connectivity estimators for high-resolution EEG recordings. Hum Brain Mapp. 2007;28:143–157. doi: 10.1002/hbm.20263. - DOI - PMC - PubMed
LinkOut - more resources
Full Text Sources
Other Literature Sources
Miscellaneous
