

Multiple characteristics analysis of Alzheimer's electroencephalogram by power spectral density and Lempel-Ziv complexity
- PMID: 27066150
- PMCID: PMC4805689
- DOI: 10.1007/s11571-015-9367-8
Multiple characteristics analysis of Alzheimer's electroencephalogram by power spectral density and Lempel-Ziv complexity
Abstract
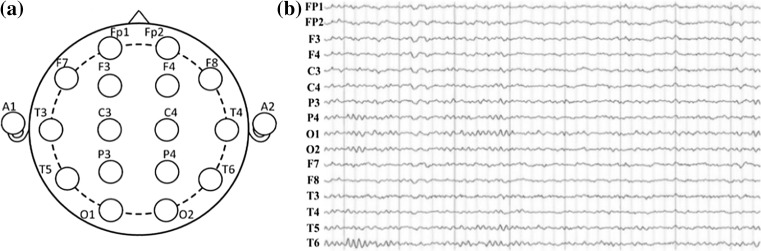
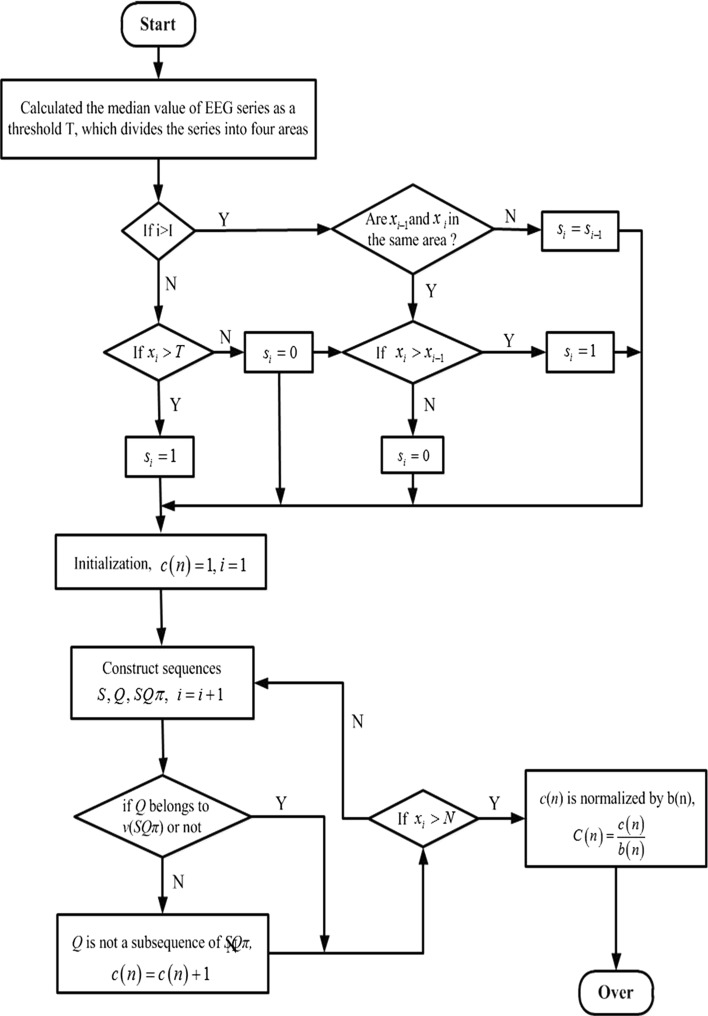
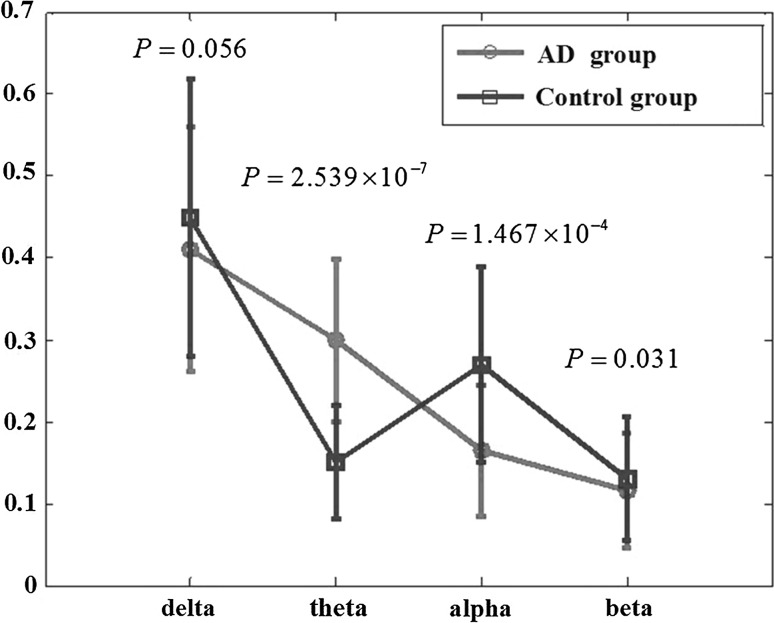
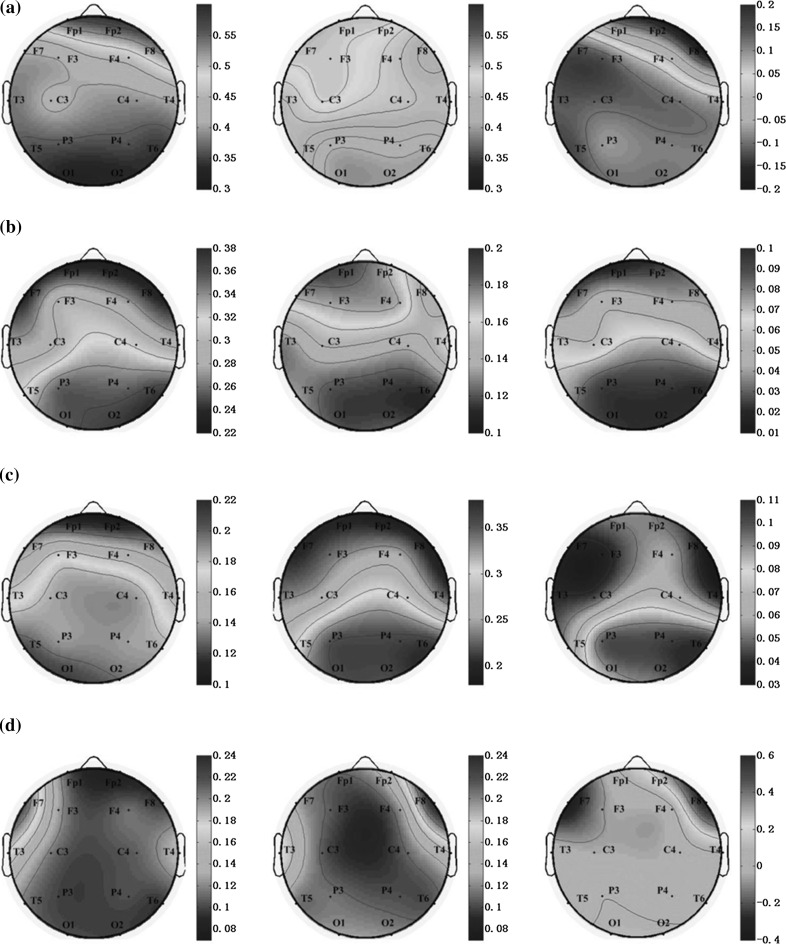
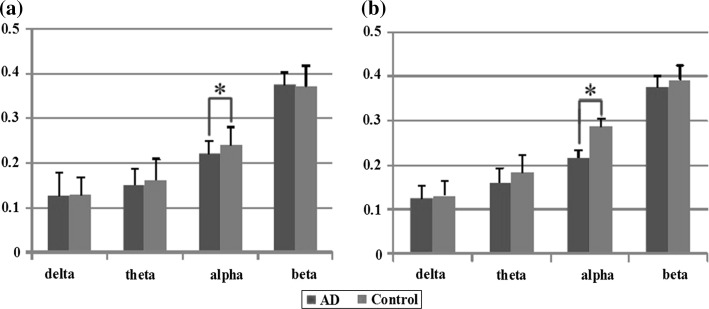
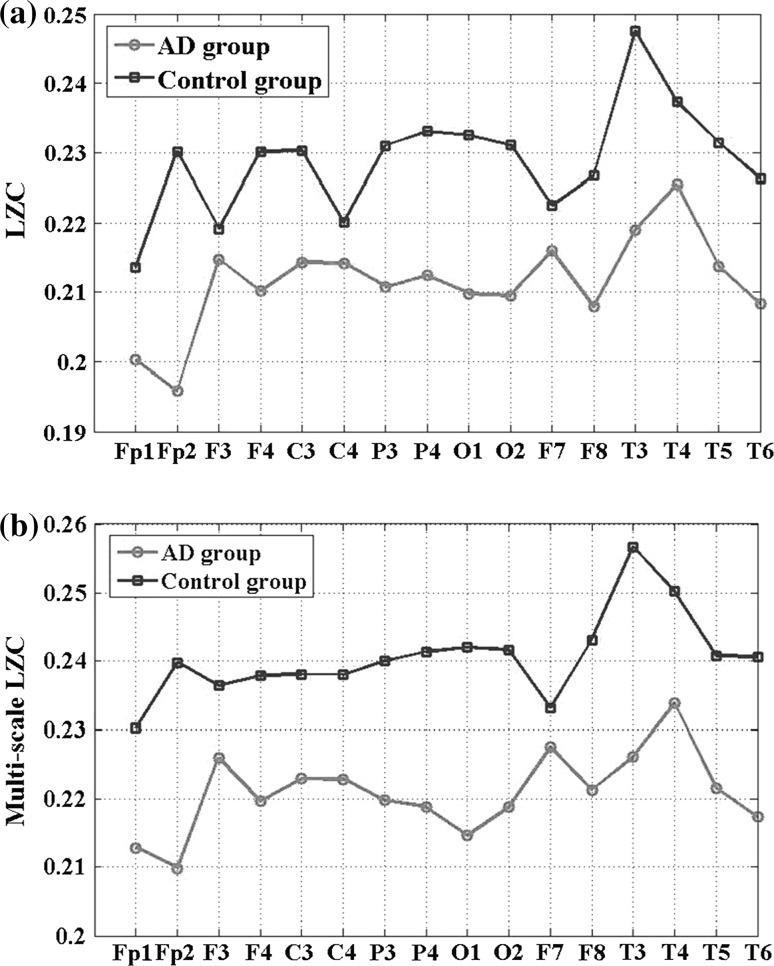
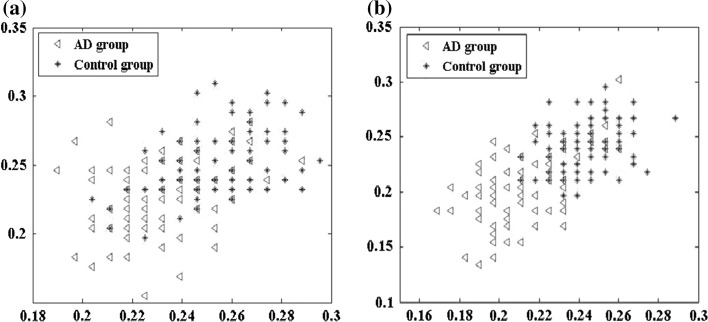
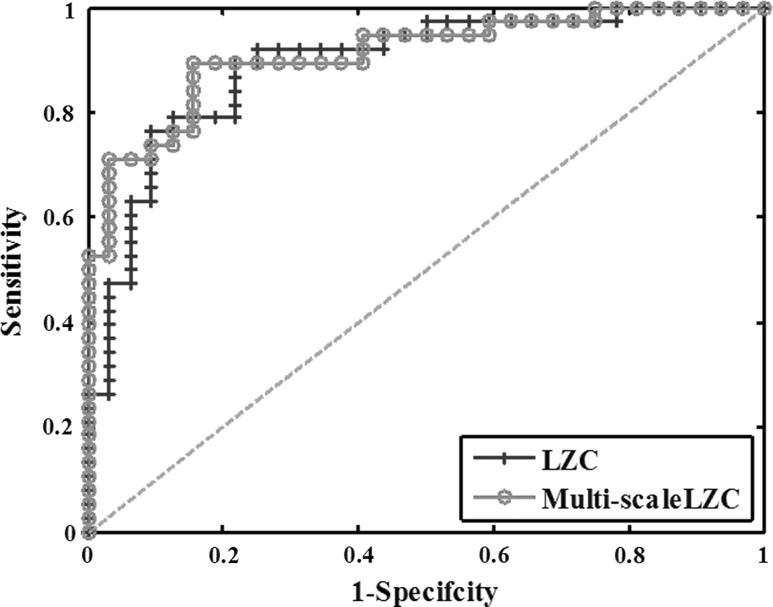
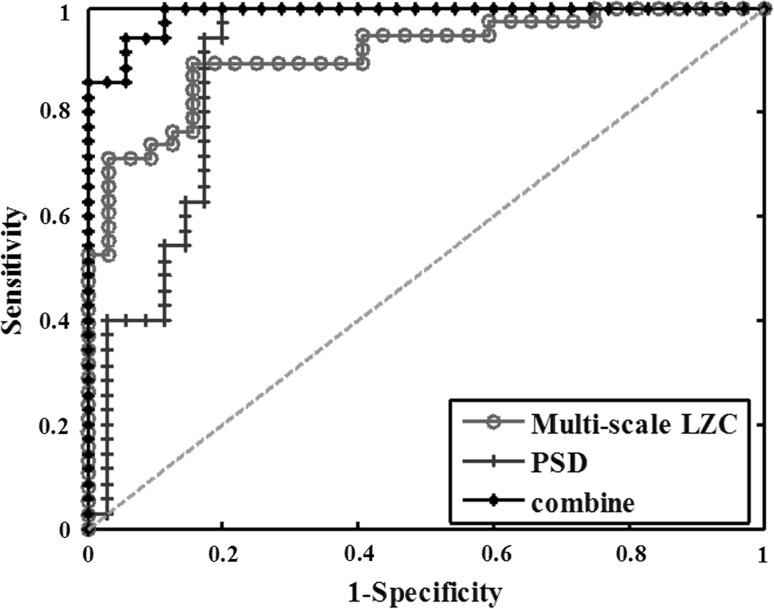
To investigate the electroencephalograph (EEG) background activity in patients with Alzheimer's disease (AD), power spectrum density (PSD) and Lempel-Ziv (LZ) complexity analysis are proposed to extract multiple effective features of EEG signals from AD patients and further applied to distinguish AD patients from the normal controls. Spectral analysis based on autoregressive Burg method is first used to quantify the power distribution of EEG series in the frequency domain. Compared with the control group, the relative PSD of AD group is significantly higher in the theta frequency band while lower in the alpha frequency bands. In order to explore the nonlinear information, Lempel-Ziv complexity (LZC) and multi-scale LZC is further applied to all electrodes for the four frequency bands. Analysis results demonstrate that the group difference is significant in the alpha frequency band by LZC and multi-scale LZC analysis. However, the group difference of multi-scale LZC is much more remarkable, manifesting as more channels undergo notable changes, particularly in electrodes O1 and O2 in the occipital area. Moreover, the multi-scale LZC value provided a better classification between the two groups with an accuracy of 85.7 %. In addition, we combine both features of the relative PSD and multi-scale LZC to discriminate AD patients from the normal controls by applying a support vector machine model in the alpha frequency band. It is indicated that the two groups can be clearly classified by the combined feature. Importantly, the accuracy of the classification is higher than that of any one feature, reaching 91.4 %. The obtained results show that analysis of PSD and multi-scale LZC can be taken as a potential comprehensive measure to distinguish AD patients from the normal controls, which may benefit our understanding of the disease.
Keywords: Alzheimer’s disease; Electroencephalogram; Lempel–Ziv complexity; Multi-scale Lempel–Ziv complexity; Power spectrum density.
Figures
Similar articles
-
Power spectral density and coherence analysis of Alzheimer's EEG.Cogn Neurodyn. 2015 Jun;9(3):291-304. doi: 10.1007/s11571-014-9325-x. Epub 2014 Dec 16. Cogn Neurodyn. 2015. PMID: 25972978 Free PMC article.
-
The potential of the Lempel-Ziv complexity of the EEG in diagnosing cognitive impairment in patients with temporal lobe epilepsy.Epileptic Disord. 2023 Jun;25(3):331-342. doi: 10.1002/epd2.20044. Epub 2023 Apr 28. Epileptic Disord. 2023. PMID: 36938881
-
Neural complexity in patients with poststroke depression: A resting EEG study.J Affect Disord. 2015 Dec 1;188:310-8. doi: 10.1016/j.jad.2015.09.017. Epub 2015 Sep 11. J Affect Disord. 2015. PMID: 26402253
-
Complexity Measures for EEG Microstate Sequences: Concepts and Algorithms.Brain Topogr. 2024 Mar;37(2):296-311. doi: 10.1007/s10548-023-01006-2. Epub 2023 Sep 26. Brain Topogr. 2024. PMID: 37751054 Free PMC article. Review.
-
A Review of Methods for Estimating Algorithmic Complexity: Options, Challenges, and New Directions.Entropy (Basel). 2020 May 30;22(6):612. doi: 10.3390/e22060612. Entropy (Basel). 2020. PMID: 33286384 Free PMC article. Review.
Cited by
-
Hemispheric asymmetry non-linear analysis of EEG during emotional responses from idiopathic Parkinson's disease patients.Cogn Neurodyn. 2016 Jun;10(3):225-34. doi: 10.1007/s11571-016-9375-3. Epub 2016 Jan 28. Cogn Neurodyn. 2016. PMID: 27275378 Free PMC article.
-
Generation Mechanism and Prediction Model for Low Frequency Noise Induced by Energy Dissipating Submerged Jets during Flood Discharge from a High Dam.Int J Environ Res Public Health. 2016 Jun 15;13(6):594. doi: 10.3390/ijerph13060594. Int J Environ Res Public Health. 2016. PMID: 27314374 Free PMC article.
-
Systematic Review on Resting-State EEG for Alzheimer's Disease Diagnosis and Progression Assessment.Dis Markers. 2018 Oct 4;2018:5174815. doi: 10.1155/2018/5174815. eCollection 2018. Dis Markers. 2018. PMID: 30405860 Free PMC article.
-
Multivariate multi-scale weighted permutation entropy analysis of EEG complexity for Alzheimer's disease.Cogn Neurodyn. 2017 Jun;11(3):217-231. doi: 10.1007/s11571-016-9418-9. Epub 2016 Nov 15. Cogn Neurodyn. 2017. PMID: 28559952 Free PMC article.
-
Fractal Phototherapy in Maximizing Retina and Brain Plasticity.Adv Neurobiol. 2024;36:585-637. doi: 10.1007/978-3-031-47606-8_31. Adv Neurobiol. 2024. PMID: 38468055
References
LinkOut - more resources
Full Text Sources
Other Literature Sources
