HEXT, a software supporting tree-based screens for hybrid taxa in multilocus data sets, and an evaluation of the homoplasy excess test
- PMID: 27066216
- PMCID: PMC4824276
- DOI: 10.1111/2041-210X.12490
HEXT, a software supporting tree-based screens for hybrid taxa in multilocus data sets, and an evaluation of the homoplasy excess test
Abstract
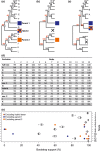
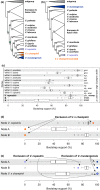
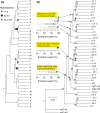
The homoplasy excess test (HET) is a tree-based screen for hybrid taxa in multilocus nuclear phylogenies. Homoplasy between a hybrid taxon and the clades containing the parental taxa reduces bootstrap support in the tree. The HET is based on the expectation that excluding the hybrid taxon from the data set increases the bootstrap support for the parental clades, whereas excluding non-hybrid taxa has little effect on statistical node support. To carry out a HET, bootstrap trees are calculated with taxon-jackknife data sets, that is excluding one taxon (species, population) at a time. Excess increase in bootstrap support for certain nodes upon exclusion of a particular taxon indicates the hybrid (the excluded taxon) and its parents (the clades with increased support).We introduce a new software program, hext, which generates the taxon-jackknife data sets, runs the bootstrap tree calculations, and identifies excess bootstrap increases as outlier values in boxplot graphs. hext is written in r language and accepts binary data (0/1; e.g. AFLP) as well as co-dominant SNP and genotype data.We demonstrate the usefulness of hext in large SNP data sets containing putative hybrids and their parents. For instance, using published data of the genus Vitis (~6,000 SNP loci), hext output supports V. × champinii as a hybrid between V. rupestris and V. mustangensis.With simulated SNP and AFLP data sets, excess increases in bootstrap support were not always connected with the hybrid taxon (false positives), whereas the expected bootstrap signal failed to appear on several occasions (false negatives). Potential causes for both types of spurious results are discussed.With both empirical and simulated data sets, the taxon-jackknife output generated by hext provided additional signatures of hybrid taxa, including changes in tree topology across trees, consistent effects of exclusions of the hybrid and the parent taxa, and moderate (rather than excessive) increases in bootstrap support. hext significantly facilitates the taxon-jackknife approach to hybrid taxon detection, even though the simple test for excess bootstrap increase may not reliably identify hybrid taxa in all applications.
Keywords: AFLP; Canidae; SNP; Vitis champinii; bootstrap support; homoplasy excess test; hybridization; phylogenetics.
Figures


Similar articles
-
Homoplasy and clade support.Syst Biol. 2009 Apr;58(2):184-98. doi: 10.1093/sysbio/syp019. Epub 2009 Jun 29. Syst Biol. 2009. PMID: 20525577
-
Is homoplasy or lineage sorting the source of incongruent mtdna and nuclear gene trees in the stiff-tailed ducks (Nomonyx-Oxyura)?Syst Biol. 2005 Feb;54(1):35-55. doi: 10.1080/10635150590910249. Syst Biol. 2005. PMID: 15805009
-
Increased gene sampling strengthens support for higher-level groups within leaf-mining moths and relatives (Lepidoptera: Gracillariidae).BMC Evol Biol. 2011 Jun 24;11:182. doi: 10.1186/1471-2148-11-182. BMC Evol Biol. 2011. PMID: 21702958 Free PMC article.
-
Split-specific bootstrap measures for quantifying phylogenetic stability and the influence of taxon selection.Mol Phylogenet Evol. 2016 Dec;105:114-125. doi: 10.1016/j.ympev.2016.08.017. Epub 2016 Aug 24. Mol Phylogenet Evol. 2016. PMID: 27568211
-
ANOTHER MONOPHYLY INDEX: REVISITING THE JACKKNIFE.Cladistics. 1995 Mar;11(1):33-56. doi: 10.1111/j.1096-0031.1995.tb00003.x. Cladistics. 1995. PMID: 34920599
Cited by
-
Delineating species along shifting shorelines: Tropheus (Teleostei, Cichlidae) from the southern subbasin of Lake Tanganyika.Front Zool. 2018 Nov 13;15:42. doi: 10.1186/s12983-018-0287-4. eCollection 2018. Front Zool. 2018. PMID: 30459820 Free PMC article.
-
Shifting barriers and phenotypic diversification by hybridisation.Ecol Lett. 2017 May;20(5):651-662. doi: 10.1111/ele.12766. Epub 2017 Apr 6. Ecol Lett. 2017. PMID: 28384842 Free PMC article.
References
-
- Abbott, R.J. & Rieseberg, L.H. (2012) Hybrid Speciation. Encyclopaedia of Life Sciences (eLS). John Wiley & Sons, Chichester, UK.
-
- Felsenstein, J. (1985) Confidence limits on phylogenies: an approach using the bootstrap. Evolution, 39, 783–791. - PubMed
-
- Geiger, M.F. , McCrary, J.K. & Schliewen, U.K. (2010) Not a simple case – A first comprehensive phylogenetic hypothesis for the Midas cichlid complex in Nicaragua (Teleostei: Cichlidae: Amphilophus). Molecular Phylogenetics and Evolution, 56, 1011–1024. - PubMed
Grants and funding
LinkOut - more resources
Full Text Sources
Other Literature Sources
