

Predicting the occurrence of major adverse cardiac events within 30 days of a vascular surgery: an empirical comparison of the minimum p value method and ROC curve approach using individual patient data meta-analysis
- PMID: 27066338
- PMCID: PMC4783313
- DOI: 10.1186/s40064-016-1936-8
Predicting the occurrence of major adverse cardiac events within 30 days of a vascular surgery: an empirical comparison of the minimum p value method and ROC curve approach using individual patient data meta-analysis
Abstract
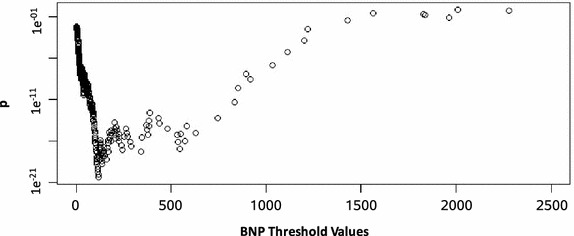
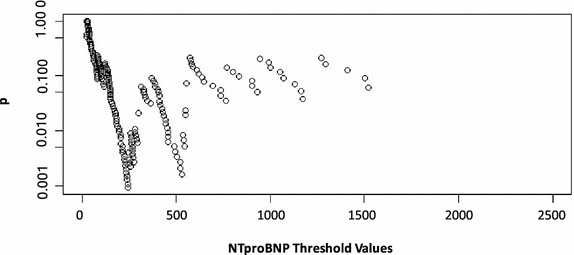
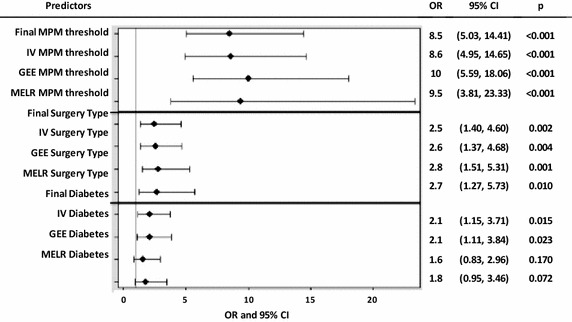
We aimed to compare the minimum p value method and the area under the receiver operating characteristics (ROC) curve approach to categorize continuous biomarkers for the prediction of postoperative 30-day major adverse cardiac events in noncardiac vascular surgery patients. Individual-patient data from six cohorts reporting B-type natriuretic peptide (BNP) or N-terminal pro-B-type natriuretic peptide (NTproBNP) were obtained. These biomarkers were dichotomized using the minimum p value method and compared with previously reported ROC curve-derived thresholds using logistic regression analysis. A final prediction model was developed, internally validated, and assessed for its sensitivity to clustering effects. Finally, a preoperative risk score system was proposed. Thresholds identified by the minimum p value method and ROC curve approach were 115.57 pg/ml (p < 0.001) and 116 pg/ml for BNP, and 241.7 pg/ml (p = 0.001) and 277.5 pg/ml for NTproBNP, respectively. The minimum p value thresholds were slightly stronger predictors based on our logistic regression analysis. The final model included a composite predictor of the minimum p value method's BNP and NTproBNP thresholds [odds ratio (OR) = 8.5, p < 0.001], surgery type (OR = 2.5, p = 0.002), and diabetes (OR = 2.1, p = 0.015). Preoperative risks using the scoring system ranged from 2 to 49 %. The minimum p value method and ROC curve approach identify similar optimal thresholds. We propose to replace the revised cardiac risk index with our risk score system for individual-specific preoperative risk stratification after noncardiac nonvascular surgery.
Keywords: Biostatistics; Cardiovascular epidemiology; Minimum p value; Pre-operative risk; ROC curve approach; Vascular surgery.
Figures
References
-
- Allison PD. Logistic regression using SAS: theory and application. Cary: SAS; 2012.
-
- Boersma E, Kertai MD, Schouten O, Bax JJ, Noordzij P, Steyerberg EW, Schinkel AF, van Santen M, Simoons ML, Thomson IR, Klein J, van Urk H, Poldermans D. Perioperative cardiovascular mortality in noncardiac surgery: validation of the Lee cardiac risk index. Am J Med. 2005;118(10):1134–1141. doi: 10.1016/j.amjmed.2005.01.064. - DOI - PubMed
-
- Bolliger D, Seeberger MD, Lurati Buse GA, Christen P, Rupinski B, Gurke L, Filipovic M. A preliminary report on the prognostic significance of preoperative brain natriuretic peptide and postoperative cardiac troponin in patients undergoing major vascular surgery. Anesth Analg. 2009;108(4):1069–1075. doi: 10.1213/ane.0b013e318194f3e6. - DOI - PubMed
LinkOut - more resources
Full Text Sources
Other Literature Sources
