. 2016 Apr 4;3(2):ENEURO.0133-15.2016.
doi: 10.1523/ENEURO.0133-15.2016. eCollection 2016 Mar-Apr.

Longitudinal Effects of Ketamine on Dendritic Architecture In Vivo in the Mouse Medial Frontal Cortex

Affiliations

Longitudinal Effects of Ketamine on Dendritic Architecture In Vivo in the Mouse Medial Frontal Cortex

Victoria Phoumthipphavong et al. eNeuro. .

Abstract

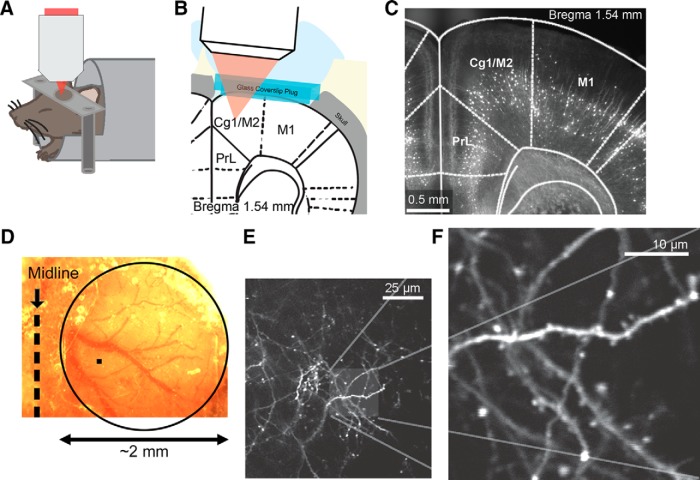
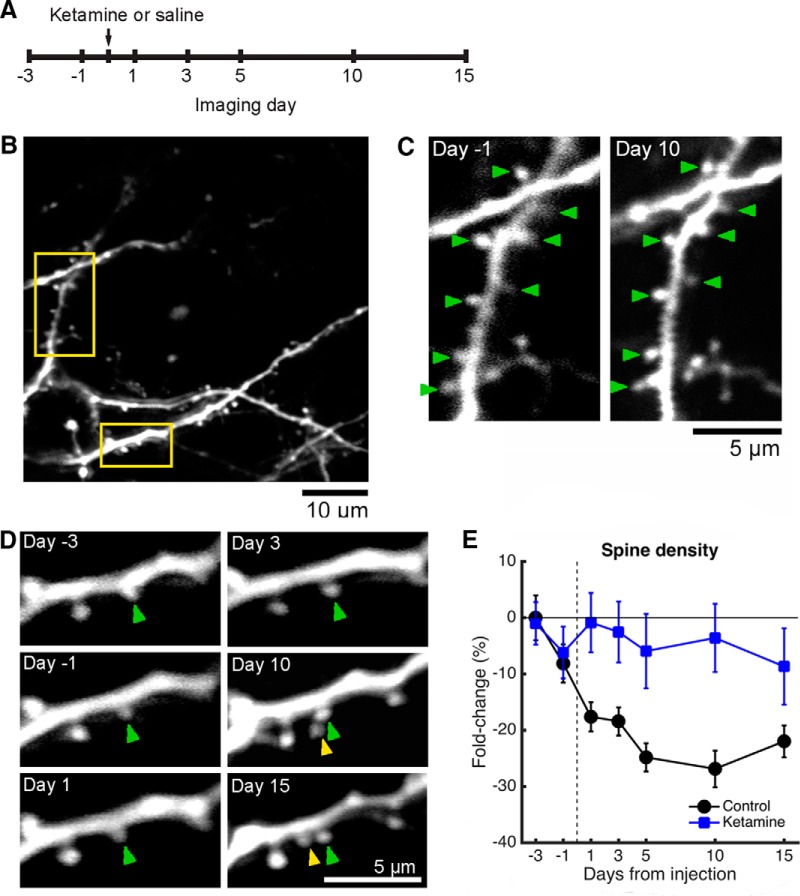
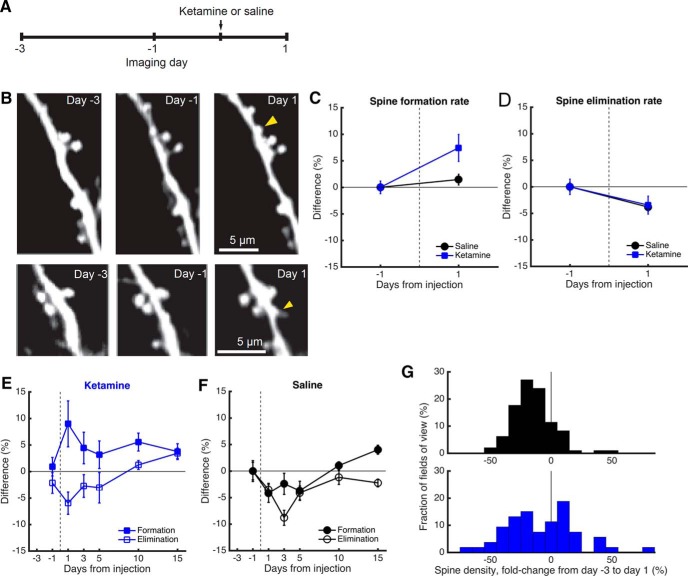
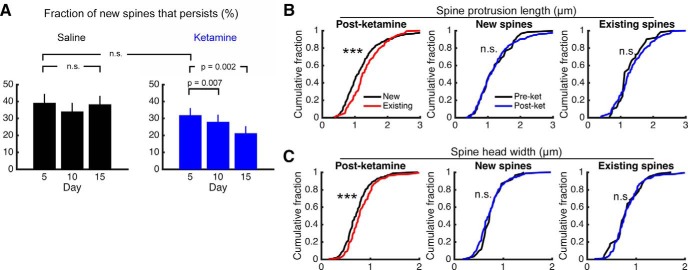
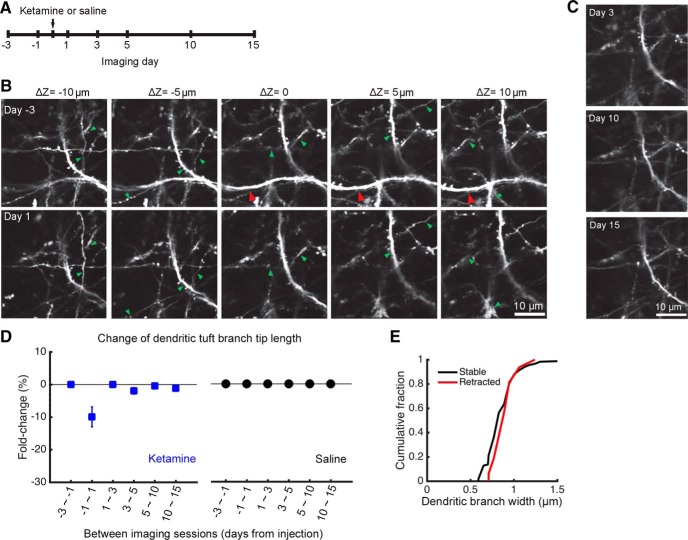
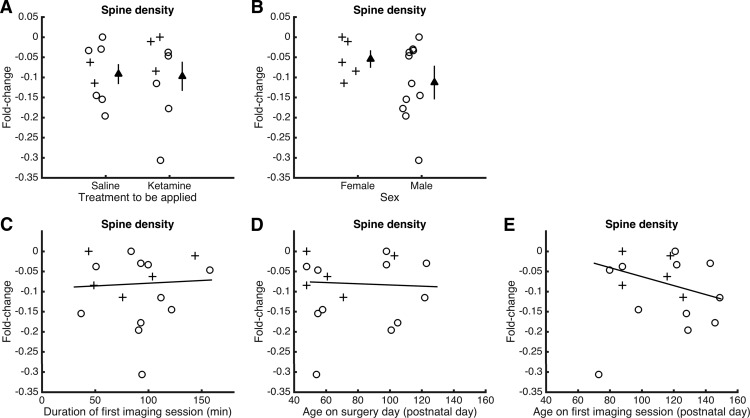
A single subanesthetic dose of ketamine, an NMDA receptor antagonist, leads to fast-acting antidepressant effects. In rodent models, systemic ketamine is associated with higher dendritic spine density in the prefrontal cortex, reflecting structural remodeling that may underlie the behavioral changes. However, turnover of dendritic spines is a dynamic process in vivo, and the longitudinal effects of ketamine on structural plasticity remain unclear. The purpose of the current study is to use subcellular resolution optical imaging to determine the time course of dendritic alterations in vivo following systemic ketamine administration in mice. We used two-photon microscopy to visualize repeatedly the same set of dendritic branches in the mouse medial frontal cortex (MFC) before and after a single injection of ketamine or saline. Compared to controls, ketamine-injected mice had higher dendritic spine density in MFC for up to 2 weeks. This prolonged increase in spine density was driven by an elevated spine formation rate, and not by changes in the spine elimination rate. A fraction of the new spines following ketamine injection was persistent, which is indicative of functional synapses. In a few cases, we also observed retraction of distal apical tuft branches on the day immediately after ketamine administration. These results indicate that following systemic ketamine administration, certain dendritic inputs in MFC are removed immediately, while others are added gradually. These dynamic structural modifications are consistent with a model of ketamine action in which the net effect is a rebalancing of synaptic inputs received by frontal cortical neurons.

Keywords: dendrites; dendritic spines; frontal cortex; ketamine; structural plasticity; two-photon microscopy.


Figures

Figure 1.
Figure 1.
Longitudinal imaging of dendritic architecture in the mouse medial frontal cortex. A, Schematic of the imaging experiment. B, Schematic of the long-term window implant. C, Fluorescence image of a fixed coronal brain slice from a Thy1-GFP-M mouse following longitudinal imaging. Cg1 and M2 (i.e., the MFC) were imaged in this study. PrL, prelimbic cortex. M1, primary motor cortex. D, Bright-field image of the long-term window implant. The glass window has an ∼2-mm-diameter width (circle), which is much larger than the imaging field of view of ∼60 × 60 μm (filled square). E, A low-magnification, in vivo two-photon image from layer 1 of the MFC in a Thy1-GFP-M mouse. Distal apical tuft branches from GFP-expressing layer 5 pyramidal neurons were visible. F, A high-magnification image of a region in E.
Figure 2.
Figure 2.
Systemic ketamine administration leads to higher dendritic spine density for at least 2 weeks relative to that of controls. A, Time line of the experiment. Ketamine was administered at a dose of 10 mg/kg through intraperitoneal injection. B, An example imaging field of view acquired on day −3 in a Thy1-GFP-M mouse. Yellow boxes indicate the dendritic branches shown as examples in C and D. C, Images of an apical dendritic tuft branch at days −1 and 10 from ketamine administration in a Thy1-GFP-M mouse. In the bottom right, axonal processes and boutons are visible. Green arrowhead, stable spine. D, Another apical dendritic tuft branch from the same field of view at days −3, −1, 1, 3, 10, and 15 from ketamine administration in a Thy1-GFP-M mouse. A new spine (yellow arrowhead) appeared on day 10 next to a stable spine (green arrowhead). E, Change in dendritic spine density across days, expressed as a fold change from the value measured on the first imaging session. The mouse was injected with either ketamine (blue square) or saline (black circle). Values are reported as the mean ± SEM. N = 28 and 25 fields of view across 7 sessions for ketamine- and saline-injected mice.
Figure 3.
Figure 3.
Higher spine density is due to an elevated rate of spine formation. A, Time line of the experiment. Ketamine was administered at a dose of 10 mg/kg through intraperitoneal injection. B, Images of two different apical dendritic tuft branches at days −3, −1, and 1 from ketamine administration in a Thy1-GFP-M mouse. Yellow arrowhead, new spine. C, Change in spine formation rate, expressed as the difference from the value measured between days −3 and −1 (i.e., preinjection sessions). The mouse was injected with either ketamine (blue square) or saline (black circle). Values are reported as the mean ± SEM. N = 58 and 97 fields of view across three sessions for ketamine- and saline-injected mice. D, Same as C for spine elimination rate. E, Change in spine turnover dynamics across days for mice injected with ketamine. Solid square, spine formation rate. Open square, spine elimination rate. Values are reported as the mean ± SEM. F, Same as E for controls with saline injection. N = 28 and 25 fields of view across seven sessions for ketamine- and saline-injected mice. G, A histogram of the change in dendritic spine density, expressed as the fold change from day −3 to day 1 from injection. Top, saline. Bottom, ketamine. N = 58 and 97 fields of view for ketamine- and saline-injected mice.
Figure 4.
Figure 4.
Newly formed protrusions following systemic ketamine administration are consistent with nascent spines. A, The fraction of newly formed spines found on day 1 that could be observed again on day 5, 10, or 15 for mice injected with saline (black) or ketamine (blue). Paired t test for comparisons across days in the same condition. Unpaired t test for the comparison across conditions. The p values are shown as is without multiple-comparison correction. Values are reported as the mean ± SEM. N = 28 and 25 fields of view for ketamine- and saline-injected mice. B, Distribution of spine protrusion lengths, comparing newly formed spines and existing stable spines that were on the same dendritic branch. Measurements were taken either before ketamine administration, on day −1, or after ketamine administration, on day 1, 3, 5, 10, or 15. ***, p < 0.001, two-sample Kolmogorov–Smirnov test. N = 61 new spines and 61 matched existing neighboring spines measured before ketamine administration. N = 328 new spines and 328 matched existing neighboring spines measured after ketamine administration. C, Same as B for spine head widths.
Figure 5.
Figure 5.
Systemic ketamine administration associated with the retraction of distal apical tuft branches. A, Time line of the experiment. Ketamine was administered at a dose of 10 mg/kg through intraperitoneal injection. B, Images from multiple z-depths of a volumetric acquisition of dendritic architecture obtained in a Thy1-GFP-M mouse before and after ketamine administration. Note that, although most branch segments were stable (green arrowhead), a segment in the middle of the volume has retracted (red arrowhead). C, Same field of view as B at days 3, 10, and 15 from ketamine administration. D, Change in distal apical tuft branch length in layer 1 across days, with the fold change calculated by dividing the length of each session by that from the prior session. The mouse was injected with either ketamine (blue square) or saline vehicle (black circles). Values are reported as the mean ± SEM. N = 28 and 25 fields of view across seven sessions for ketamine- and saline-injected mice. E, Distributions of dendritic branch widths measured on day −1, plotted separately for those distal apical tuft branches that were stable (black) or retracted (red) on day 1. N = 117 stable and 16 retracted dendritic segments from ketamine-injected mice.
Figure 6.
Figure 6.
Potential factors contributing to the decline of dendritic spine density prior to injection. A, Fold change in dendritic spine density from day −3 to day −1 (preinjection) for mice to be injected with saline or ketamine. Circle, male. Cross, female. Filled triangle, mean ± SEM. B, Same as A for female vs male mice. C, Fold change in dendritic spine density from day −3 to day −1 (preinjection) plotted as a function of the duration of the imaging session on day −3. Circle, male. Cross, female. Line, linear fit excluding the outlier at −0.3. D, Same as C for age at the time of surgery. E, Same as C for age at the time of the first imaging session.

Similar articles

Cited by

References

    1. Autry AE, Adachi M, Nosyreva E, Na ES, Los MF, Cheng P-F, Kavalali ET, Monteggia LM (2011) NMDA receptor blockade at rest triggers rapid behavioural antidepressant responses. Nature 475:91–95. 10.1038/nature10130 - DOI - PMC - PubMed
    1. Berman RM, Cappiello A, Anand A, Oren DA, Heninger GR, Charney DS, Krystal JH (2000) Antidepressant effects of ketamine in depressed patients. Biol Psychiatry 47:351–354. - PubMed
    1. Bessa JM, Ferreira D, Melo I, Marques F, Cerqueira JJ, Palha JA, Almeida OFX, Sousa N (2009) The mood-improving actions of antidepressants do not depend on neurogenesis but are associated with neuronal remodeling. Mol Psychiatry 14:764–73–739. 10.1038/mp.2008.119 - DOI - PubMed
    1. Carrier N, Kabbaj M (2013) Sex differences in the antidepressant-like effects of ketamine. Neuropharmacology 70:27–34. 10.1016/j.neuropharm.2012.12.009 - DOI - PubMed
    1. Cerqueira JJ, Taipa R, Uylings HBM, Almeida OFX, Sousa N (2007) Specific configuration of dendritic degeneration in pyramidal neurons of the medial prefrontal cortex induced by differing corticosteroid regimens. Cereb Cortex 17:1998–2006. 10.1093/cercor/bhl108 - DOI - PubMed

Publication types

MeSH terms

LinkOut - more resources