

Unaccounted uncertainty from qPCR efficiency estimates entails uncontrolled false positive rates
- PMID: 27067838
- PMCID: PMC4827196
- DOI: 10.1186/s12859-016-0997-6
Unaccounted uncertainty from qPCR efficiency estimates entails uncontrolled false positive rates
Abstract
Background: Accurate adjustment for the amplification efficiency (AE) is an important part of real-time quantitative polymerase chain reaction (qPCR) experiments. The most commonly used correction strategy is to estimate the AE by dilution experiments and use this as a plug-in when efficiency correcting the Δ Δ C q . Currently, it is recommended to determine the AE with high precision as this plug-in approach does not account for the AE uncertainty, implicitly assuming an infinitely precise AE estimate. Determining the AE with such precision, however, requires tedious laboratory work and vast amounts of biological material. Violation of the assumption leads to overly optimistic standard errors of the Δ Δ C q , confidence intervals, and p-values which ultimately increase the type I error rate beyond the expected significance level. As qPCR is often used for validation it should be a high priority to account for the uncertainty of the AE estimate and thereby properly bounding the type I error rate and achieve the desired significance level.
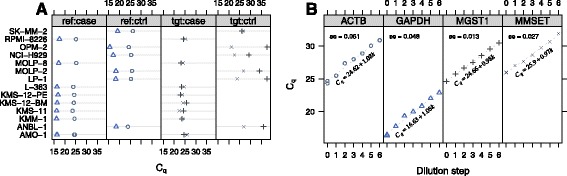
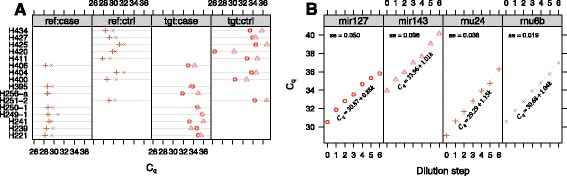
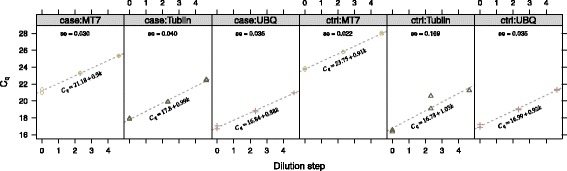
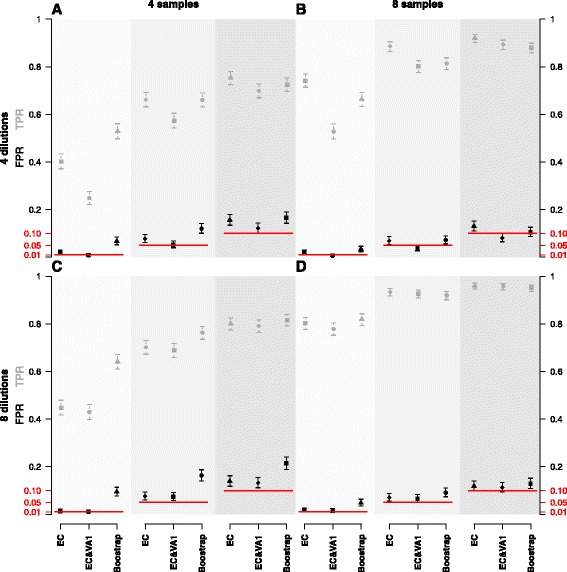
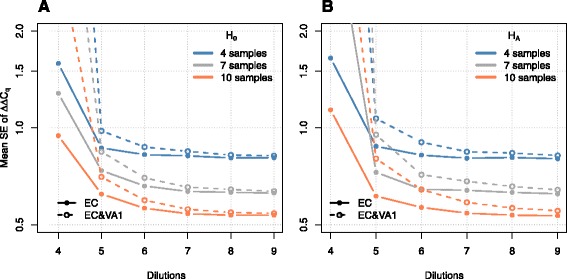
Results: We suggest and benchmark different methods to obtain the standard error of the efficiency adjusted Δ Δ C q using the statistical delta method, Monte Carlo integration, or bootstrapping. Our suggested methods are founded in a linear mixed effects model (LMM) framework, but the problem and ideas apply in all qPCR experiments. The methods and impact of the AE uncertainty are illustrated in three qPCR applications and a simulation study. In addition, we validate findings suggesting that MGST1 is differentially expressed between high and low abundance culture initiating cells in multiple myeloma and that microRNA-127 is differentially expressed between testicular and nodal lymphomas.
Conclusions: We conclude, that the commonly used efficiency corrected quantities disregard the uncertainty of the AE, which can drastically impact the standard error and lead to increased false positive rates. Our suggestions show that it is possible to easily perform statistical inference of Δ Δ C q , whilst properly accounting for the AE uncertainty and better controlling the false positive rate.
Keywords: Amplification efficiency; Delta-delta Cq; Efficiency adjusted; Error propagation; qPCR; Δ Δ C q.
Figures
References
-
- Rabinow P. Making PCR: A Story of Biotechnology. London: The University of Chicago Press; 1996.
Publication types
MeSH terms
Substances
LinkOut - more resources
Full Text Sources
Other Literature Sources
Medical
Research Materials
