. 2016 Apr 12:6:24280.
doi: 10.1038/srep24280.

Molar concentration from sequential 2-D water-window X-ray ptychography and X-ray fluorescence in hydrated cells

Affiliations

Molar concentration from sequential 2-D water-window X-ray ptychography and X-ray fluorescence in hydrated cells

M W M Jones et al. Sci Rep. .

Abstract

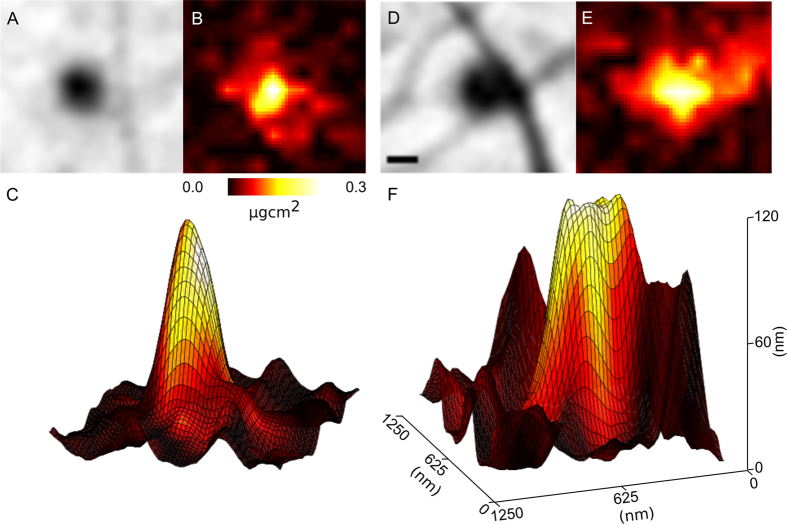
Recent developments in biological X-ray microscopy have allowed structural information and elemental distribution to be simultaneously obtained by combining X-ray ptychography and X-ray fluorescence microscopy. Experimentally, these methods can be performed simultaneously; however, the optimal conditions for each measurement may not be compatible. Here, we combine two distinct measurements of ultrastructure and elemental distribution, with each measurement performed under optimised conditions. By combining optimised ptychography and fluorescence information we are able to determine molar concentrations from two-dimensional images, allowing an investigation into the interactions between the environment sensing filopodia in fibroblasts and extracellular calcium. Furthermore, the biological ptychography results we present illustrate a point of maturity where the technique can be applied to solve significant problems in structural biology.


Figures

Figure 1
Figure 1. Required thickness of protein (C30H50N9O10 S and density of 1.35 gcm2) in water to induce a phase change of more than 0.01 radians greater than the surrounding water.
For photon energy of 500 eV, the required thickness is 100 times less than for 10 keV, allowing 100 times greater sensitivity to fine features. The kα line position for a selection of biologically relevant elements is also included (arrows). Figure prepared using data from.
Figure 2
Figure 2. Phase of the complex transmission function of one corner of an MEF sealed in a fully hydrated environment.
Here we see an area of the lamellopodium (L) with both actin bundles (A) and fine filopodia extending from it. Small aggregates of material can be seen in the extracellular regions. Inset shows bent filopodia co-located with small aggregates, labelled i to iii. The scale bar on the inset is equal to 500 nm.
Figure 3
Figure 3
The scattering quotient map of aggregate (b) and filopodia identified in Fig. 2 (ii - inset). Here we can see that the scattering quotient of the aggregate and filopodia is approximately equal to 0.20, corresponding to a mix a protein and lipids. Scale bar equals 200 nm.
Figure 4
Figure 4
(A) Calcium and (B) Phosphorus X-ray fluorescence distributions of the entire MEF. As discussed in the text, these elemental distributions allow the direction of motion to be deduced, and is indicated in (B) with an arrow. The box in (A) indicated the region of interest, presented in (C), which shows the Ca distribution (red) overlaid with the phase of the complex transmission function of the same area initially presented in Fig. 2. The co-localisation of some features such as focal adhesion sites (arrow) and in extracellular features (lines) in both images is evident. In some case, the co-localisation of Ca and extracellular aggregates occurs at a bend in the filopodia (examples labelled i and ii correspond to those identified in Fig. 2). The scale bar in (B) is equal to 15 μm, while the areal density in μgcm−2 is given in each panel.
Figure 5
Figure 5
(A,B,D,E), phase and areal density of Ca of aggregates of biological material at bent filopodia identified in Figs 2 and 3 as i and ii. (C,F) Represent the calculated thickness of the biological aggregate with the colour of the surface mapped to the areal density of Ca (B,E). From these images, we can see the volume of biological material that gives rise to the Ca signal, and use this information to determine the molar concentration of Ca in each aggregate. The scale bar in A is equal to 200 nm, while the vertical axis in (C) refers to the thickness of protein in (C,F).
Figure 6
Figure 6. Relationship between filopodia bend angle and Ca concentration showing an increase in the bend angle as a function of [Ca].
This result is in line with previous studies, demonstrating the effectiveness of the presented method.

Similar articles

Cited by

  • Correlative cellular ptychography with functionalized nanoparticles at the Fe L-edge.
    Gallagher-Jones M, Dias CSB, Pryor A Jr, Bouchmella K, Zhao L, Lo YH, Cardoso MB, Shapiro D, Rodriguez J, Miao J. Gallagher-Jones M, et al. Sci Rep. 2017 Jul 6;7(1):4757. doi: 10.1038/s41598-017-04784-5. Sci Rep. 2017. PMID: 28684732 Free PMC article.
  • Resolving 500 nm axial separation by multi-slice X-ray ptychography.
    Huang X, Yan H, He Y, Ge M, Öztürk H, Fang YLL, Ha S, Lin M, Lu M, Nazaretski E, Robinson IK, Chu YS. Huang X, et al. Acta Crystallogr A Found Adv. 2019 Mar 1;75(Pt 2):336-341. doi: 10.1107/S2053273318017229. Epub 2019 Feb 12. Acta Crystallogr A Found Adv. 2019. PMID: 30821266 Free PMC article.
  • High Reflectance Nanoscale V/Sc Multilayer for Soft X-ray Water Window Region.
    Huang Q, Yi Q, Cao Z, Qi R, Loch RA, Jonnard P, Wu M, Giglia A, Li W, Louis E, Bijkerk F, Zhang Z, Wang Z. Huang Q, et al. Sci Rep. 2017 Oct 10;7(1):12929. doi: 10.1038/s41598-017-13222-5. Sci Rep. 2017. PMID: 29018232 Free PMC article.
  • X-ray-Based Techniques to Study the Nano-Bio Interface.
    Sanchez-Cano C, Alvarez-Puebla RA, Abendroth JM, Beck T, Blick R, Cao Y, Caruso F, Chakraborty I, Chapman HN, Chen C, Cohen BE, Conceição ALC, Cormode DP, Cui D, Dawson KA, Falkenberg G, Fan C, Feliu N, Gao M, Gargioni E, Glüer CC, Grüner F, Hassan M, Hu Y, Huang Y, Huber S, Huse N, Kang Y, Khademhosseini A, Keller TF, Körnig C, Kotov NA, Koziej D, Liang XJ, Liu B, Liu S, Liu Y, Liu Z, Liz-Marzán LM, Ma X, Machicote A, Maison W, Mancuso AP, Megahed S, Nickel B, Otto F, Palencia C, Pascarelli S, Pearson A, Peñate-Medina O, Qi B, Rädler J, Richardson JJ, Rosenhahn A, Rothkamm K, Rübhausen M, Sanyal MK, Schaak RE, Schlemmer HP, Schmidt M, Schmutzler O, Schotten T, Schulz F, Sood AK, Spiers KM, Staufer T, Stemer DM, Stierle A, Sun X, Tsakanova G, Weiss PS, Weller H, Westermeier F, Xu M, Yan H, Zeng Y, Zhao Y, Zhao Y, Zhu D, Zhu Y, Parak WJ. Sanchez-Cano C, et al. ACS Nano. 2021 Mar 23;15(3):3754-3807. doi: 10.1021/acsnano.0c09563. Epub 2021 Mar 2. ACS Nano. 2021. PMID: 33650433 Free PMC article.
  • Simultaneous structural and elemental nano-imaging of human brain tissue.
    Genoud S, Jones MWM, Trist BG, Deng J, Chen S, Hare DJ, Double KL. Genoud S, et al. Chem Sci. 2020 Aug 10;11(33):8919-8927. doi: 10.1039/d0sc02844d. Chem Sci. 2020. PMID: 34123146 Free PMC article.

References

    1. Jiang H. et al. Quantitative 3D imaging of whole, unstained cells by using X-ray diffraction microscopy. PNAS 107, 11234–11239 (2010). - PMC - PubMed
    1. Nelson J. et al. High-resolution x-ray diffraction microscopy of specifically labeled yeast cells. PNAS 107, 7235–7239 (2010). - PMC - PubMed
    1. Miao J. et al. Imaging whole Escherichia coli bacteria by using single-particle x-ray diffraction. Proceedings of the National Academy of Science USA 100, 110–112 (2003). - PMC - PubMed
    1. Shapiro D. et al. Biological imaging by soft x-ray diffraction microscopy. PNAS 102, 15343–15346 (2005). - PMC - PubMed
    1. Mancuso A. P. et al. Internal structure of an intact Convallaria majalis pollen grain observed with X-ray Fresnel coherent diffractive imaging. Opt. Express 20, 26778–26785 (2012). - PubMed

Publication types

LinkOut - more resources