

Polycomb Ezh2 controls the fate of GABAergic neurons in the embryonic cerebellum
- PMID: 27068104
- PMCID: PMC4920161
- DOI: 10.1242/dev.132902
Polycomb Ezh2 controls the fate of GABAergic neurons in the embryonic cerebellum
Abstract
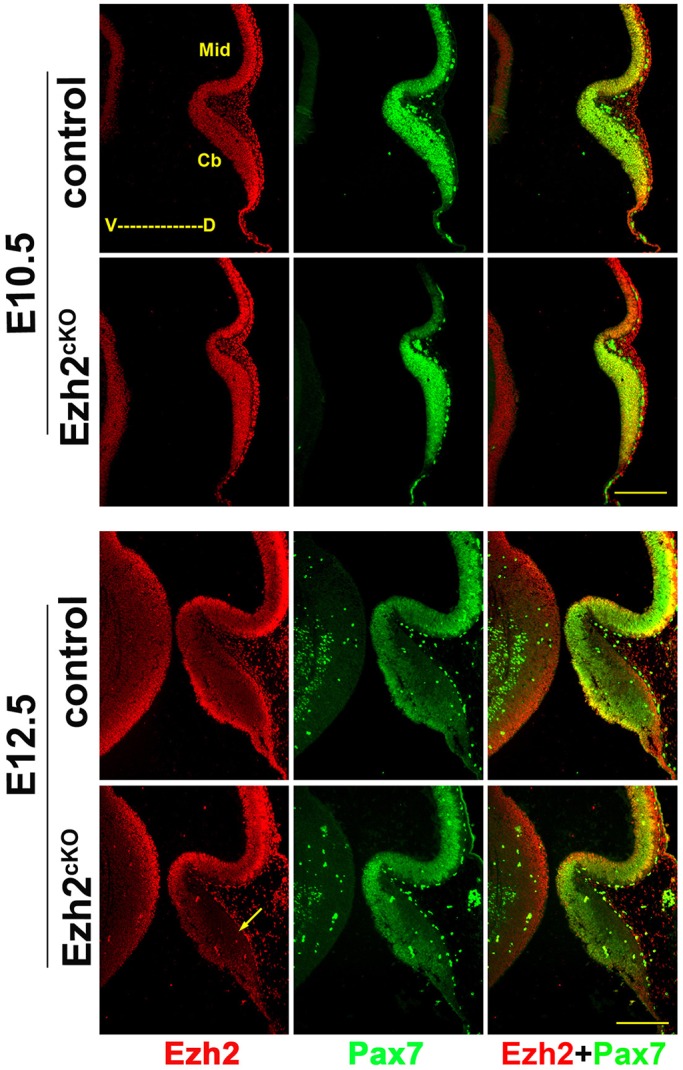
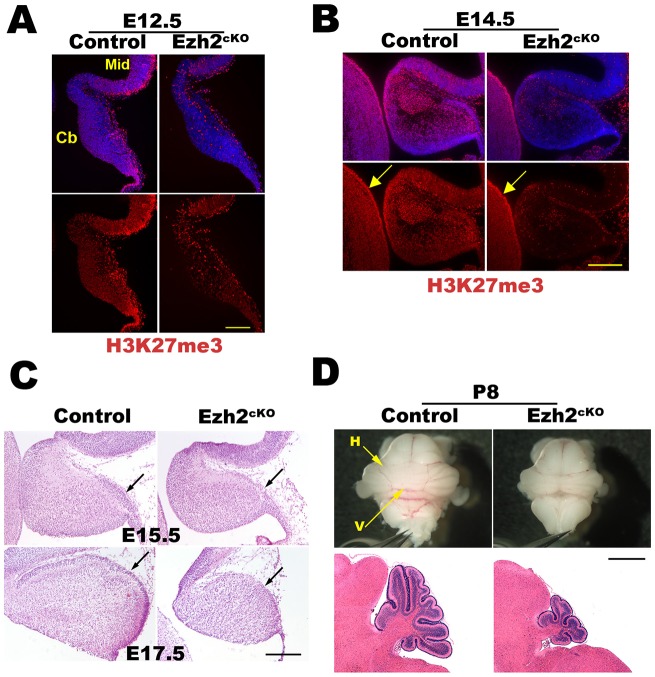
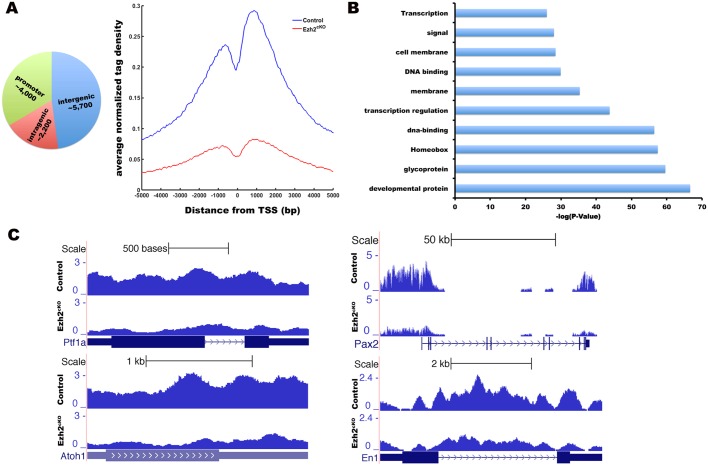
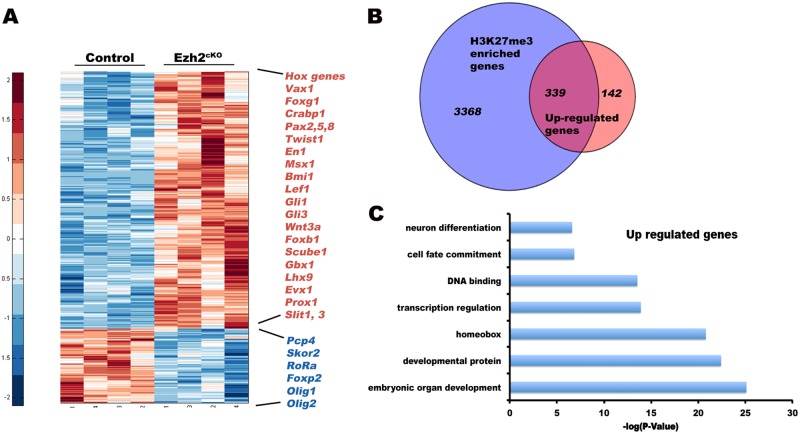
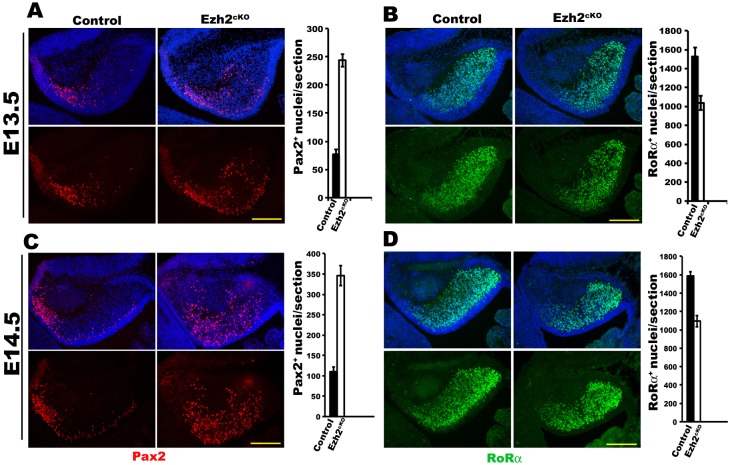
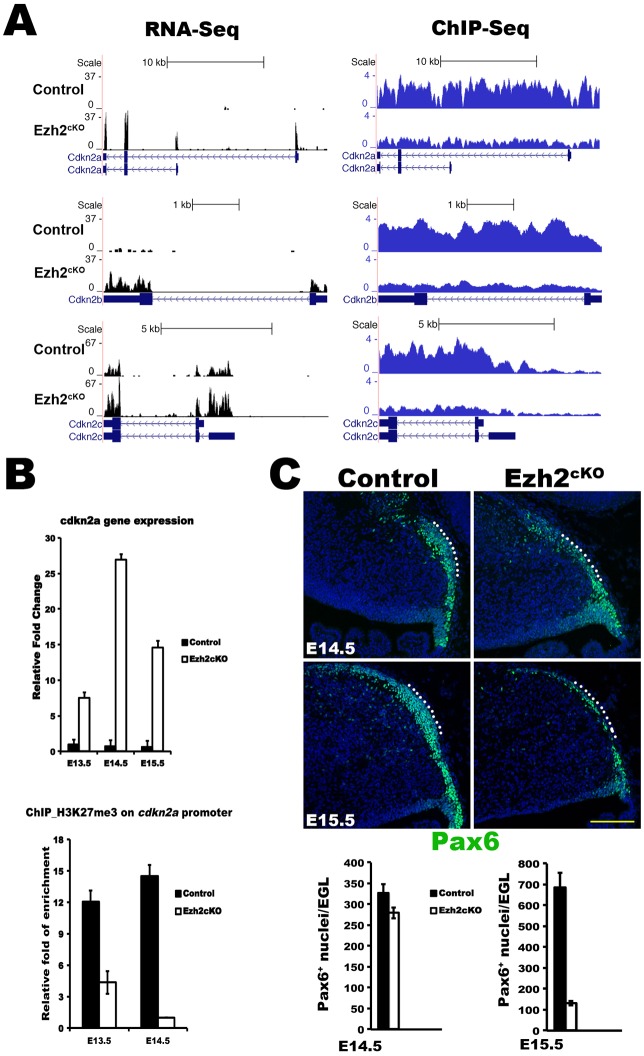
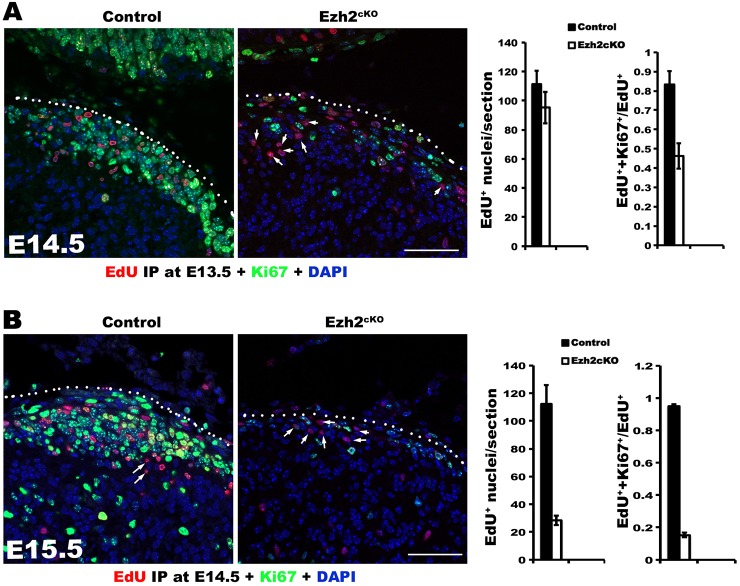
Although the genetic interactions between signaling pathways and transcription factors have been largely decoded, much remains to be learned about the epigenetic regulation of cerebellar development. Here, we report that cerebellar deletion of Ezh2, the methyltransferase subunit of the PRC2 complex, results in reduced H3K27me3 and profound transcriptional dysregulation, including that of a set of transcription factors directly involved in cerebellar neuronal cell-type specification and differentiation. Such transcriptional changes lead to increased GABAergic interneurons and decreased Purkinje cells. Transcriptional changes also inhibit the proliferation of granule precursor cells derived from the rhombic lip. The loss of both cell types ultimately results in cerebellar hypoplasia. These findings indicate Ezh2/PRC2 plays crucial roles in regulating neurogenesis from both cerebellar germinal zones.
Keywords: Cerebellum; Ezh2; Neurogenesis; PRC2; Polycomb; Purkinje cells.
© 2016. Published by The Company of Biologists Ltd.
Conflict of interest statement
The authors declare no competing or financial interests.
Figures
Similar articles
-
Roles of H3K27me2 and H3K27me3 Examined during Fate Specification of Embryonic Stem Cells.Cell Rep. 2016 Oct 25;17(5):1369-1382. doi: 10.1016/j.celrep.2016.09.087. Cell Rep. 2016. PMID: 27783950 Free PMC article.
-
Abnormal cerebellar development and Purkinje cell defects in Lgl1-Pax2 conditional knockout mice.Dev Biol. 2014 Nov 1;395(1):167-81. doi: 10.1016/j.ydbio.2014.07.007. Epub 2014 Jul 19. Dev Biol. 2014. PMID: 25050931
-
Characterization of Olig2 expression during cerebellar development.Gene Expr Patterns. 2014 May;15(1):1-7. doi: 10.1016/j.gep.2014.02.001. Epub 2014 Mar 1. Gene Expr Patterns. 2014. PMID: 24594479
-
Development and evolution of cerebellar neural circuits.Dev Growth Differ. 2012 Apr;54(3):373-89. doi: 10.1111/j.1440-169X.2012.01348.x. Dev Growth Differ. 2012. PMID: 22524607 Review.
-
EZH2 as a Regulator of CD8+ T Cell Fate and Function.Front Immunol. 2020 Oct 6;11:593203. doi: 10.3389/fimmu.2020.593203. eCollection 2020. Front Immunol. 2020. PMID: 33117406 Free PMC article. Review.
Cited by
-
Variational autoencoding of gene landscapes during mouse CNS development uncovers layered roles of Polycomb Repressor Complex 2.Nucleic Acids Res. 2022 Feb 22;50(3):1280-1296. doi: 10.1093/nar/gkac006. Nucleic Acids Res. 2022. PMID: 35048973 Free PMC article.
-
DNMT1 modulates interneuron morphology by regulating Pak6 expression through crosstalk with histone modifications.Epigenetics. 2018;13(5):536-556. doi: 10.1080/15592294.2018.1475980. Epub 2018 Aug 7. Epigenetics. 2018. PMID: 29912614 Free PMC article.
-
The Dynamic Partnership of Polycomb and Trithorax in Brain Development and Diseases.Epigenomes. 2019;3(3):17-24. doi: 10.3390/epigenomes3030017. Epub 2019 Aug 21. Epigenomes. 2019. PMID: 33912356 Free PMC article.
-
Histone Lysine Methylation and Neurodevelopmental Disorders.Int J Mol Sci. 2017 Jun 30;18(7):1404. doi: 10.3390/ijms18071404. Int J Mol Sci. 2017. PMID: 28665350 Free PMC article. Review.
-
The Elongation Factor Spt6 Maintains ESC Pluripotency by Controlling Super-Enhancers and Counteracting Polycomb Proteins.Mol Cell. 2017 Oct 19;68(2):398-413.e6. doi: 10.1016/j.molcel.2017.09.016. Epub 2017 Oct 12. Mol Cell. 2017. PMID: 29033324 Free PMC article.
References
-
- Bouchard M., Pfeffer P. and Busslinger M. (2000). Functional equivalence of the transcription factors Pax2 and Pax5 in mouse development. Development 127, 3703-3713. - PubMed
-
- Bracken A. P., Kleine-Kohlbrecher D., Dietrich N., Pasini D., Gargiulo G., Beekman C., Theilgaard-Monch K., Minucci S., Porse B. T., Marine J.-C. et al. (2007). The Polycomb group proteins bind throughout the INK4A-ARF locus and are disassociated in senescent cells. Genes Dev. 21, 525-530. 10.1101/gad.415507 - DOI - PMC - PubMed
Publication types
MeSH terms
Substances
LinkOut - more resources
Full Text Sources
Other Literature Sources
Molecular Biology Databases
