

The population history of Garra orientalis (Teleostei: Cyprinidae) using mitochondrial DNA and microsatellite data with approximate Bayesian computation
- PMID: 27068356
- PMCID: PMC4827224
- DOI: 10.1186/s12862-016-0645-9
The population history of Garra orientalis (Teleostei: Cyprinidae) using mitochondrial DNA and microsatellite data with approximate Bayesian computation
Abstract
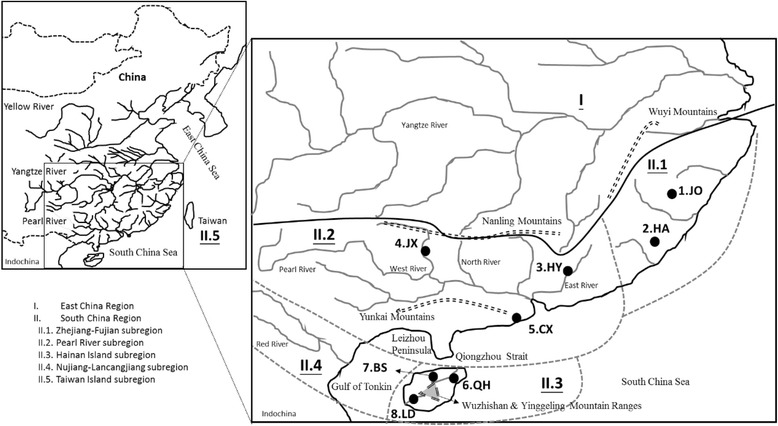
Background: The South China landmass has been characterized by a complex geological history, including mountain lifting, climate changes, and river capture/reversal events. To determine how this complexity has influenced the landmass's phylogeography, our study examined the phylogeography of Garra orientalis, a cyprinid widely distributed in South China, using sequences from the mitochondrial DNA control region and cytochrome b gene (1887 bp) and polymorphisms of thirteen microsatellite loci.
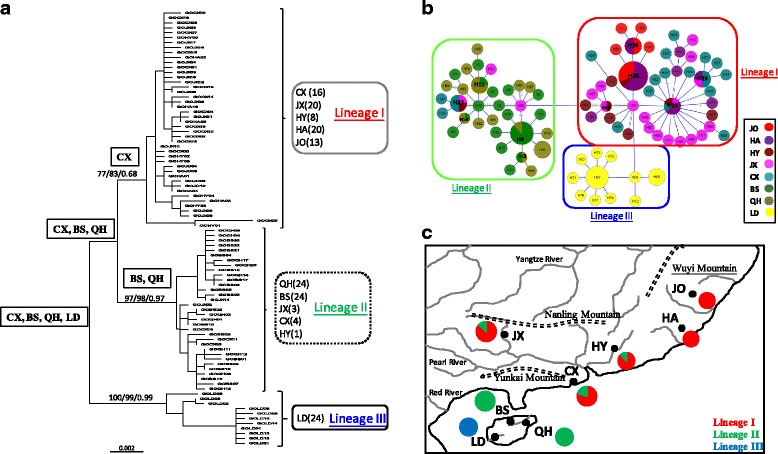
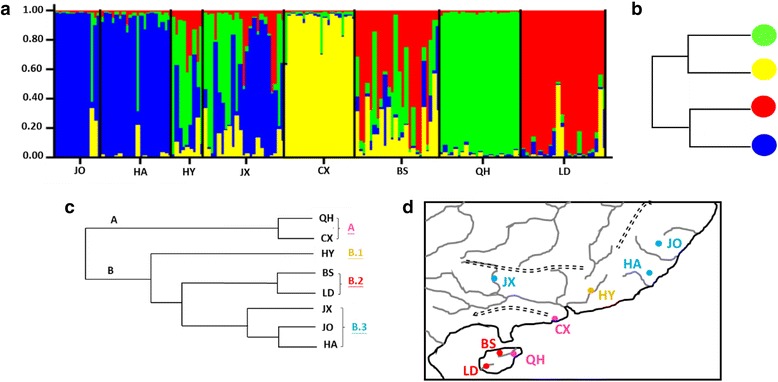
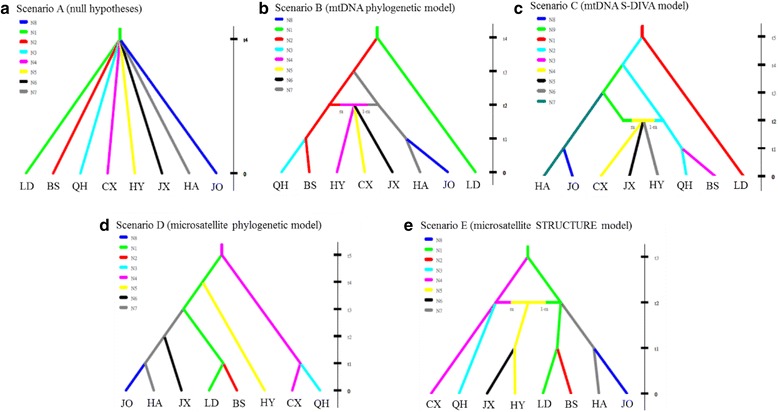
Results: In total, 157 specimens were collected from eight populations. All 88 mtDNA haplotypes were identified as belonging to three major lineages, and these lineages were almost allopatric in their distributions. The results of a statistical dispersal-vicariance analysis suggested that the ancestral populations of G. orientalis were distributed south of the Yunkai Mountains, including on Hainan Island. The mtDNA data revealed a strong relationship between phylogeny and geography. In the microsatellite analysis, a total of 339 alleles with an average of 26 alleles per locus were observed across thirteen microsatellite loci. A clustering algorithm for microsatellite data revealed an admixture-like genetic structure. Although the mtDNA and microsatellite data sets displayed a discordant population structure, the results of an approximate Bayesian computation approach showed that these two markers revealed congruent historical signals. The population history of G. orientalis reflects vicariance events and dispersal related to the complex geological history of South China.
Conclusion: Our results (i) found that the discordances between mtDNA and microsatellite markers were accounted for by admixtures; (ii) showed that the Wuzhishan and Yinggeling mountain ranges and Qiongzhou Strait were important barriers limiting gene exchange between populations on both sides; (iii) indicated that during glaciation and inter-glacial periods, the strait and continental shelves were exposed and sank, which contributed with the dispersion and differentiation of populations; and (iv) displayed that the admixtures between lineages took place in coastal populations and then colonized the tributaries of the Pearl River.
Keywords: Approximate Bayesian computation; Garra orientalis; Microsatellite; Mitochondria; Phylogeography.
Figures
References
-
- Li SZ. Studies on zoogeographical divisions for fresh water fishes of China. Beijing: Science; 1981.
-
- Li JP, Zheng CY. Ichthyofauna of Hanjiang River for freshwater fishes. J Jinan Univ. 1998;19:100–104.
-
- Zhang HN, Chen CG, Huang KR, Li ZQ, Zhang FL, Chen GZ. The new geological structures, tectonic movements and geological environment in coastal line of South China. Beijing: Earthquake; 1990.
-
- Zheng HS. Freshwater Fish Fauna and Biogeography of Eight Rivers in East Guangdong, China. Master dissertation. Institute of Zoology, the South China Normal University (in Chinese); 2004.
-
- Chiang TY, Lin HD, Zhao J, Kuo PH, Lee TW, Hsu KC. Diverse processes shape deep phylogeographical divergence in Cobitis sinensis (Teleostei: Cobitidae) in East Asia. J Zool Syst Evol Res. 2013;51:316–326.
Publication types
MeSH terms
Substances
Associated data
- Actions
- Actions
- Actions
- Actions
- Actions
- Actions
- Actions
- Actions
- Actions
- Actions
- Actions
- Actions
- Actions
- Actions
- Actions
- Actions
- Actions
- Actions
- Actions
- Actions
- Actions
- Actions
- Actions
- Actions
- Actions
- Actions
- Actions
- Actions
- Actions
- Actions
- Actions
- Actions
- Actions
- Actions
- Actions
- Actions
- Actions
- Actions
- Actions
- Actions
- Actions
- Actions
- Actions
- Actions
- Actions
- Actions
- Actions
- Actions
- Actions
- Actions
- Actions
- Actions
- Actions
- Actions
- Actions
- Actions
- Actions
- Actions
- Actions
- Actions
- Actions
- Actions
- Actions
- Actions
- Actions
- Actions
- Actions
- Actions
- Actions
- Actions
- Actions
- Actions
- Actions
- Actions
- Actions
- Actions
- Actions
- Actions
- Actions
- Actions
- Actions
- Actions
- Actions
- Actions
- Actions
- Actions
- Actions
- Actions
- Actions
- Actions
- Actions
- Actions
- Actions
- Actions
- Actions
- Actions
LinkOut - more resources
Full Text Sources
Other Literature Sources
