. 2016 Sep 1;594(17):4945-66.
doi: 10.1113/JP272311. Epub 2016 May 29.

SPAK and OSR1 play essential roles in potassium homeostasis through actions on the distal convoluted tubule

Affiliations

SPAK and OSR1 play essential roles in potassium homeostasis through actions on the distal convoluted tubule

Mohammed Z Ferdaus et al. J Physiol. .

Abstract

Key points: STE20 (Sterile 20)/SPS-1 related proline/alanine-rich kinase (SPAK) and oxidative stress-response kinase-1 (OSR1) phosphorylate and activate the renal Na(+) -K(+) -2Cl(-) cotransporter 2 (NKCC2) and Na(+) Cl(-) cotransporter (NCC). Mouse models suggest that OSR1 mainly activates NKCC2-mediated sodium transport along the thick ascending limb, while SPAK mainly activates NCC along the distal convoluted tubule, but the kinases may compensate for each other. We hypothesized that disruption of both kinases would lead to polyuria and severe salt-wasting, and generated SPAK/OSR1 double knockout mice to test this. Despite a lack of SPAK and OSR1, phosphorylated NKCC2 abundance was still high, suggesting the existence of an alternative activating kinase. Compensatory changes in SPAK/OSR1-independent phosphorylation sites on both NKCC2 and NCC and changes in sodium transport along the collecting duct were also observed. Potassium restriction revealed that SPAK and OSR1 play essential roles in the emerging model that NCC activation is central to sensing changes in plasma [K(+) ].

Abstract: STE20 (Sterile 20)/SPS-1 related proline/alanine-rich kinase (SPAK) and oxidative stress-response kinase-1 (OSR1) activate the renal cation cotransporters Na(+) -K(+) -2Cl(-) cotransporter (NKCC2) and Na(+) -Cl(-) cotransporter (NCC) via phosphorylation. Knockout mouse models suggest that OSR1 mainly activates NKCC2, while SPAK mainly activates NCC, with possible cross-compensation. We tested the hypothesis that disrupting both kinases causes severe polyuria and salt-wasting by generating SPAK/OSR1 double knockout (DKO) mice. DKO mice displayed lower systolic blood pressure compared with SPAK knockout (SPAK-KO) mice, but displayed no severe phenotype even after dietary salt restriction. Phosphorylation of NKCC2 at SPAK/OSR1-dependent sites was lower than in SPAK-KO mice, but still significantly greater than in wild type mice. In the renal medulla, there was significant phosphorylation of NKCC2 at SPAK/OSR1-dependent sites despite a complete absence of SPAK and OSR1, suggesting the existence of an alternative activating kinase. The distal convoluted tubule has been proposed to sense plasma [K(+) ], with NCC activation serving as the primary effector pathway that modulates K(+) secretion, by metering sodium delivery to the collecting duct. Abundance of phosphorylated NCC (pNCC) is dramatically lower in SPAK-KO mice than in wild type mice, and the additional disruption of OSR1 further reduced pNCC. SPAK-KO and kidney-specific OSR1 single knockout mice maintained plasma [K(+) ] following dietary potassium restriction, but DKO mice developed severe hypokalaemia. Unlike mice lacking SPAK or OSR1 alone, DKO mice displayed an inability to phosphorylate NCC under these conditions. These data suggest that SPAK and OSR1 are essential components of the effector pathway that maintains plasma [K(+) ].


Figures

Figure 1
Figure 1. Disruption of SPAK/OSR1 and cloning of a truncated isoform of OSR1
A, Western blot analysis of whole kidney lysates confirmed the absence of SPAK in SPAK knockout (SPAK‐KO) and SPAK/OSR1 double knockout (DKO) mice. B, Western blots showed a significant reduction in abundance of FL‐OSR1 and a short form of OSR1 (S‐OSR1) in SPAK/OSR1 DKO mice. C, quantification of FL‐OSR1 and S‐OSR1 abundance using blot in B. Densitometry values were normalized to actin and plotted as means ± SEM. FL‐OSR1: SPAK‐KO 100±10%, DKO 16±3%; * P = 6×10⁻⁵. S‐OSR1: SPAK‐KO: 100±12% and DKO: 21±1%; * P = 0.0001, unpaired t‐tests. D, 5′RACE PCR using a primer to exon 11 of OSR1 identified a transcript which lacks exons 1–4, and instead contains a novel first exon (4A), joined to exon 5 (see cartoon). This novel exon shares no homology with exon 5A of KS‐SPAK. RT‐PCR using total RNA from mouse brain and kidney revealed that this transcript may display tissue‐specific expression, as it is absent from brain. Numbers above bars indicate primer pairs used (see Methods). M, DNA ladder; bp, base pairs; B, brain; K, kidney; S, S‐OSR1 amplicon present; FL, FL‐OSR1 amplicon present.
Figure 2
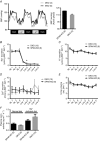
Figure 2. Effects of combined disruption of SPAK/OSR1 on blood pressure, electrolyte excretion, and plasma renin activity
A, radiotelemetry showed reduced systolic blood pressure in SPAK/OSR1 double knockout (DKO) mice. Left, tracing using 1 h average values; right, mean of the hourly averages over three dark periods ± SEM; * P = 0.001, unpaired t‐test. BE, there were no differences in 24 h urinary excretion of (B) sodium (Na+), (C) potassium (K+) or (D) calcium (Ca2+) on a normal sodium (0.49%) diet (NL 1 to NL 3) or following 5 days of dietary sodium (0.02%) restriction (Low 1 to Low 5) between SPAK knockout (SPAK‐KO) and DKO mice with the exception of a small difference in Na+ excretion after 2 days of sodium restriction (Low 2); * P = 0.005, unpaired t‐test. E, urine volumes did not show a significant difference. F, plasma renin activity (PRA), determined by measurement of angiotensin I following incubation of plasma with angiotensinogen, showed no difference between genotypes by two‐way ANOVA. For AF, values are means ± SEM.
Figure 3
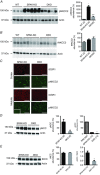
Figure 3. Effects of combined disruption of SPAK/OSR1 on abundances of total NKCC2 and NCC, and their SPAK/OSR1‐dependent phosphorylation
A, Western blot analysis showed that abundance of NKCC2 phosphorylated at the SPAK/OSR1‐dependent sites threonine 96 and threonine 101 (pNKCC2) was greater in SPAK knockout (SPAK‐KO) mice than in WT mice, or in SPAK/OSR1 double knockout (DKO) mice. Quantification (right) showed that pNKCC2 abundance was significantly greater in SPAK‐KO than in WT mice, * P = 0.0006; while pNKCC2 abundance was reduced in DKO mice compared with SPAK‐KO mice, # P = 0.0002; it was also still greater than in WT mice, P = 0.025, one‐way ANOVA, multiplicity adjusted P values. B, abundance of total NKCC2 (tNKCC2) did not differ between SPAK‐KO and DKO mice. C, immunofluorescence of kidney sections revealed residual expression of total OSR1 (tOSR1) in the renal cortex, but a complete absence in the medulla. Despite complete ablation of tOSR1 in the medulla in DKO mice, there was significant expression of pNKCC2. Inset in bottom left shows an absence of pNKCC2 in the papilla, which together with no detection of pNKCC2 at the basolateral membrane in the inner medulla confirms that the pNKCC2 antibody does not detect pNKCC1. Scale bars = 400 μm. Adjustments were made to brightness and contrast to make images clearer, and were applied to the entire image. D, representative blot showed that the abundance of NCC phosphorylated at the SPAK/OSR1‐dependent site threonine 53 (pNCC) was lower in DKO than in SPAK‐KO mice; * P = 0.005, unpaired t‐test. Note that pNCC is reduced by 90% in SPAK‐KO compared with WT mice (McCormick et al. 2011), and DKO is thus almost absent compared with WT, as shown for illustrative purposes to the right (the low signal in DKO precluded analysis as long exposure to detect the difference between SPAK‐KO and DKO resulted in oversaturation of WT signal); * P = 0.001, one‐way ANOVA, multiplicity adjusted P value. E, abundance of total NCC (tNCC) did not differ between SPAK‐KO and DKO mice. Right, pNCC/tNCC ratio determined from using values in D and E, and shows that the reduction in pNCC is an effect on phosphorylation rather than on total expression; data from two SPAK‐KO and three DKO females are included; * P = 0.0002, unpaired t‐test. For quantification in A, B, D and E, densitometry values were normalized to actin and are means ± SEM; values in parentheses represent n.
Figure 4
Figure 4. Compensatory activation of NCC in SPAK/OSR1 double knockout mice
A, schematic indicating amino‐terminal phosphorylation sites in mouse NKCC2 and NCC. Red text indicates a confirmed phosphorylation site for that particular cotransporter, while underlining represents a site that could be, but has not shown to be, phosphorylated in the other cotransporter. Well‐established SPAK/OSR1 sites are marked by stars. Both AMPK and PKA phosphorylate NKCC2 at serine 126 (triangle) in vitro, but the kinase responsible in vivo has not been definitively determined. For sites marked with squares, in vitro data have not provided clear evidence of the responsible kinase. B, quantification of phosphoproteomic data obtained from SPAK knockout (SPAK‐KO) and SPAK/OSR1 double knockout (DKO) mice on a normal diet, with abundance expressed as the mean expression ratio (DKO/SPAK‐KO) ± SEM. Left, abundance of total and phosphorylated forms of NKCC2; right, the same for NCC. The dashed line represents the ratio at which expression is equal; values above this line represent greater abundance in DKO mice, while values below represent lower abundance in DKO mice. Note that phospho‐serine 89 peptides were only detected in a single replicate. For both NCC and NKCC2, * P < 0.0001, one‐way ANOVA comparing each phosphopeptide with total cotransporter abundance. C, Western blot analysis confirmed lower abundance pS126‐NKCC2 in DKO mice than in SPAK‐KO mice, quantified below; densitometry values were normalized to actin and are means ± SEM. * P = 0.0003, unpaired t‐test. D, 22Na+ uptake assays in Xenopus oocytes suggest T122 and S124 may act synergistically with SPAK/OSR1 sites. Left, representative assay shows activities of WT NCC and phosphomimetic mutants (with either one or both sites mutated to aspartic acid, D) in ND96 (Basal), and in hypotonic low chloride conditions (Hypo low Cl), which leads to phosphorylation at SPAK/OSR1‐dependent sites. Activities are shown relative to WT NCC in basal conditions ± SEM. All mutants tended to lower basal activity compared with WT NCC, but one‐way ANOVA did not reveal a significant difference. WT NCC and all mutants displayed increased activity in hypotonic low chloride conditions (* P < 0.0001). Right, fold activation of WT or mutant NCC in hypotonic low chloride conditions (calculated using data in the left panel), which is significantly higher in T122D and T122D/S124D NCC (* P = 0.02), and trended to higher in S124D NCC (P = 0.07). One‐way ANOVAs were performed and multiplicity adjusted P values are reported.
Figure 5
Figure 5. Compensatory changes in sodium transport pathways along the collecting duct
A, Western blot analysis of whole kidney lysates from SPAK knockout (SPAK‐KO) and SPAK/OSR1 double knockout (DKO) mice on a normal diet revealed no difference in the abundance of α‐ENaC. Right‐hand panels in AC show graphs of quantification, with densitometry values normalized to actin; values are means ± SEM. B, abundance of β‐ENaC trended higher in DKO mice, but the difference was not significant (P = 0.10). C, abundance of γ‐ENaC trended lower (P = 0.05), and abundance of the cleaved γ‐ENaC N‐terminal fragment was significantly lower in DKO mice (* P = 0.02). D, to determine whether changes in ENaC subunit abundance translated into changes in ENaC activity, a 6 h urine collection was performed before and after injection of vehicle (0.09% saline) or 40 μg 25g−1 body weight amiloride. Urine sodium (Na+) was determined by flame photometry and the difference in excretion following injection of vehicle or amiloride was calculated. Values are means ± SEM. Sodium excretion increased to a greater degree in DKO mice (* P = 0.009), suggesting increased ENaC activity. E, abundance of pendrin was significantly lower in DKO mice than in SPAK‐KO mice, as shown by quantification to the right, with densitometry values normalized to actin and shown as means ± SEM (* P = 0.03). F, abundance of NDCBE was significantly elevated in DKO mice (* P = 0.004). For quantification, values were normalized to Coomassie blue staining and shown as means ± SEM. For AF, numbers in parentheses indicate n. All comparisons were made using unpaired t‐tests.
Figure 6
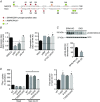
Figure 6. Effects of dietary potassium restriction on abundances of total and phosphorylated forms of NCC
A, similar to control mice (OSR1fl/fl/Pax8‐rtTA/LC1 administered vehicle, not doxycycline), inducible kidney‐specific OSR1 knockout (KS‐OSR1‐KO) mice displayed an increase in abundance of NCC phosphorylated at the SPAK/OSR1‐dependent site threonine 53 (pNCC) in response to 7 days of dietary potassium restriction (K+‐deficient diet). Values were normalized to actin, and the pNCC/tNCC ratio was calculated and plotted as means ± SEM (right). pNCC/tNCC following potassium restriction was greater than on normal diet; * P = 0.0014 for control and # P = 0.0008 for KS‐OSR1‐KO mice. B, SPAK‐KO mice displayed a robust increase in pNCC after being placed on a K+‐deficient diet, but DKO mice displayed an almost complete failure to respond. Values were normalized to actin, and the pNCC/tNCC ratio was calculated and plotted as means ± SEM (right). pNCC/tNCC following potassium restriction was greater than on normal diet in SPAK‐KO (* P < 0.0001), but not in DKO mice (P = 0.8692). For A and B, two‐way ANOVAs were performed and multiplicity adjusted P values are reported.
Figure 7
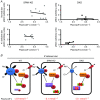
Figure 7. The inverse relationship between pNCC and plasma [K+] is absent in SPAK/OSR1 double knockout mice
A, pNCC abundance and plasma [K+] display an inverse linear relationship (Terker et al. 2016), so we examined this relationship in SPAK knockout (SPAK‐KO) and SPAK/OSR1 double knockout (DKO) mice using Pearson's correlation. On a normal diet (top), both groups showed this relationship, but in DKO mice the line was shifted down and had a significantly flatter slope (comparison of slopes, SPAK‐KO = −0.742 and DKO = −0.194, P = 0.01). Dietary K+ restriction (bottom) shifted the lines for both SPAK‐KO and DKO mice to the left compared with the lines obtained on a normal diet. The line for DKO mice was more dramatically shifted, and had a positive slope whereas that for SPAK‐KO mice was still negative (comparison of slopes, SPAK‐KO = −0.291 and DKO = +0.828, P = 0.003). B, model depicting WNK4‐SPAK/OSR1‐NCC pathway activation following dietary K+ restriction in WT, SPAK knockout (SPAK‐KO) and SPAK/OSR1 knockout (DKO) mice. SPAK plays the dominant role in NCC phosphorylation in WT mice, as confirmed by maintenance of plasma [K+] and pNCC abundance in kidney‐specific OSR1 knockout mice (not shown for clarity). In SPAK‐KO mice, OSR1 can compensate for a lack of SPAK, preserving plasma [K+]. In DKO mice, plasma [K+] is dramatically lower, suggesting that other NCC‐activating pathways are unable to compensate during K+ restriction. In WNK4 and NCC knockout mice, potassium restriction causes plasma [K+] to fall to similar levels to those seen in DKO mice.

Similar articles

Cited by

  • Differential roles of WNK4 in regulation of NCC in vivo.
    Yang YS, Xie J, Yang SS, Lin SH, Huang CL. Yang YS, et al. Am J Physiol Renal Physiol. 2018 May 1;314(5):F999-F1007. doi: 10.1152/ajprenal.00177.2017. Epub 2018 Jan 31. Am J Physiol Renal Physiol. 2018. PMID: 29384416 Free PMC article.
  • The WNK signaling pathway and salt-sensitive hypertension.
    Furusho T, Uchida S, Sohara E. Furusho T, et al. Hypertens Res. 2020 Aug;43(8):733-743. doi: 10.1038/s41440-020-0437-x. Epub 2020 Apr 14. Hypertens Res. 2020. PMID: 32286498 Review.
  • WNKs are potassium-sensitive kinases.
    Pleinis JM, Norrell L, Akella R, Humphreys JM, He H, Sun Q, Zhang F, Sosa-Pagan J, Morrison DE, Schellinger JN, Jackson LK, Goldsmith EJ, Rodan AR. Pleinis JM, et al. Am J Physiol Cell Physiol. 2021 May 1;320(5):C703-C721. doi: 10.1152/ajpcell.00456.2020. Epub 2021 Jan 13. Am J Physiol Cell Physiol. 2021. PMID: 33439774 Free PMC article.
  • WNK4 kinase: from structure to physiology.
    Murillo-de-Ozores AR, Rodríguez-Gama A, Carbajal-Contreras H, Gamba G, Castañeda-Bueno M. Murillo-de-Ozores AR, et al. Am J Physiol Renal Physiol. 2021 Mar 1;320(3):F378-F403. doi: 10.1152/ajprenal.00634.2020. Epub 2021 Jan 25. Am J Physiol Renal Physiol. 2021. PMID: 33491560 Free PMC article. Review.
  • Novel CUL3 Variant Causing Familial Hyperkalemic Hypertension Impairs Regulation and Function of Ubiquitin Ligase Activity.
    Chatrathi HE, Collins JC, Wolfe LA, Markello TC, Adams DR, Gahl WA, Werner A, Sharma P. Chatrathi HE, et al. Hypertension. 2022 Jan;79(1):60-75. doi: 10.1161/HYPERTENSIONAHA.121.17624. Epub 2021 Dec 2. Hypertension. 2022. PMID: 34878901 Free PMC article.

References

    1. Ares GR, Caceres PS & Ortiz PA (2011). Molecular regulation of NKCC2 in the thick ascending limb. Am J Physiol Renal Physiol 301, F1143–1159. - PMC - PubMed
    1. Bazua‐Valenti S, Chavez‐Canales M, Rojas‐Vega L, Gonzalez‐Rodriguez X, Vazquez N, Rodriguez‐Gama A, Argaiz ER, Melo Z, Plata C, Ellison DH, Garcia‐Valdes J, Hadchouel J & Gamba G (2015). The Effect of WNK4 on the Na+–Cl cotransporter is modulated by intracellular chloride. J Am Soc Nephrol 26, 1781–1786. - PMC - PubMed
    1. Bhalla V & Hallows KR (2008). Mechanisms of ENaC regulation and clinical implications. J Am Soc Nephrol 19, 1845–1854. - PubMed
    1. Boersema PJ, Raijmakers R, Lemeer S, Mohammed S & Heck AJ (2009). Multiplex peptide stable isotope dimethyl labeling for quantitative proteomics. Nat Protoc 4, 484–494. - PubMed
    1. Bostanjoglo M, Reeves WB, Reilly RF, Velazquez H, Robertson N, Litwack G, Morsing P, Dorup J, Bachmann S & Ellison DH (1998). 11β‐hydroxysteroid dehydrogenase, mineralocorticoid receptor, and thiazide‐sensitive Na–Cl cotransporter expression by distal tubules. J Am Soc Nephrol 9, 1347–1358. - PubMed

MeSH terms