. 2016 Apr 19;15(3):519-530.
doi: 10.1016/j.celrep.2016.03.054. Epub 2016 Apr 7.

BET Bromodomain Inhibition Releases the Mediator Complex from Select cis-Regulatory Elements

Affiliations

BET Bromodomain Inhibition Releases the Mediator Complex from Select cis-Regulatory Elements

Anand S Bhagwat et al. Cell Rep. .

Abstract

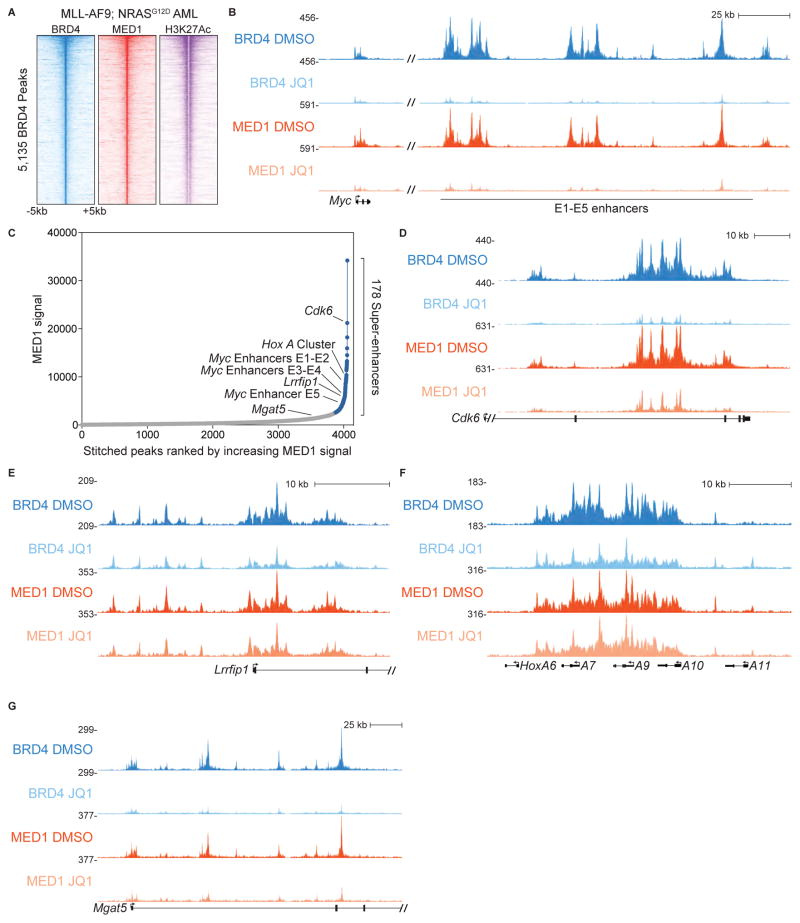
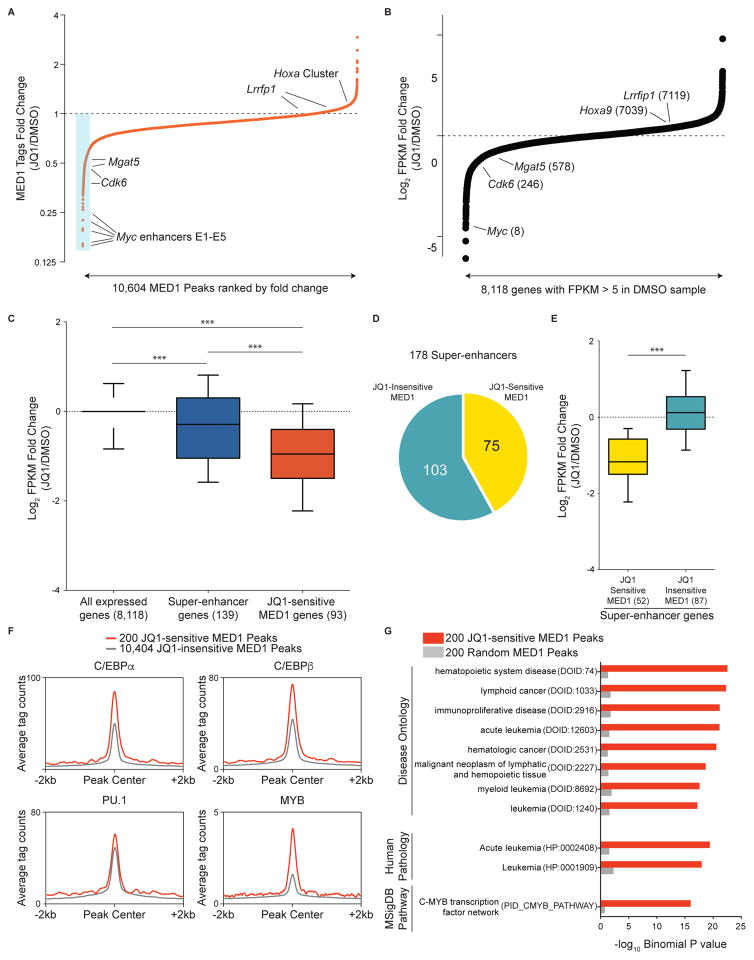
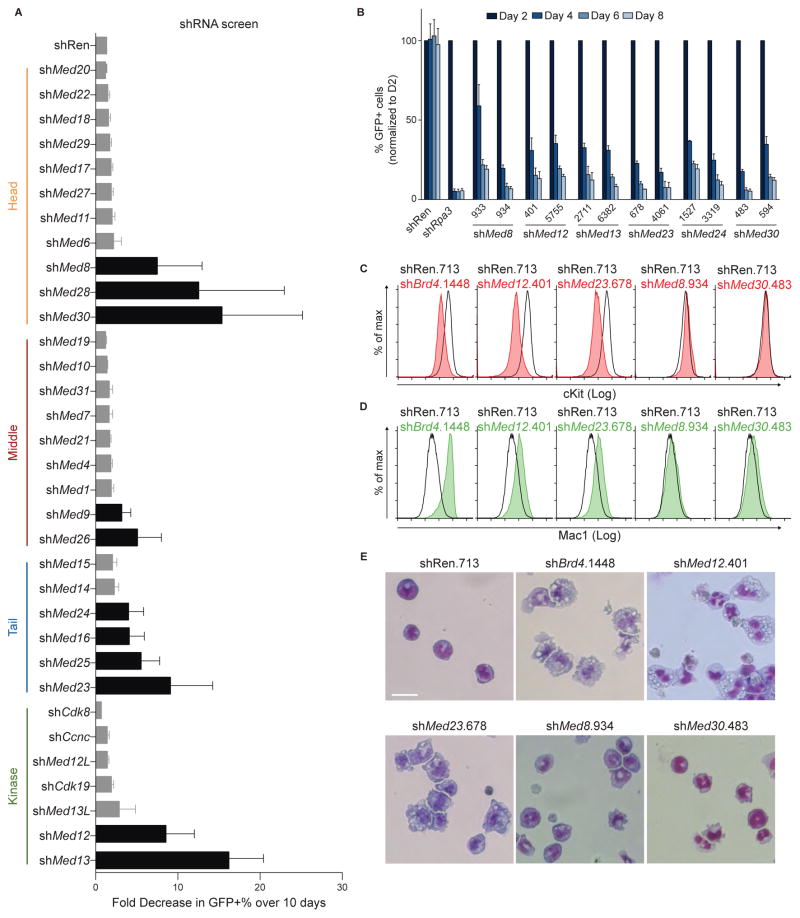
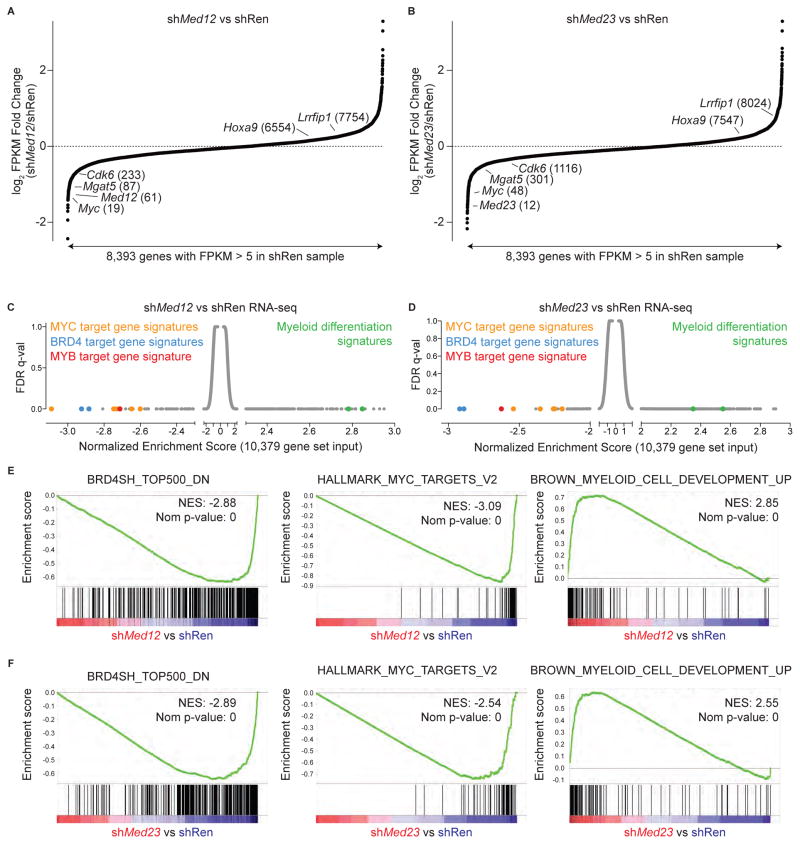
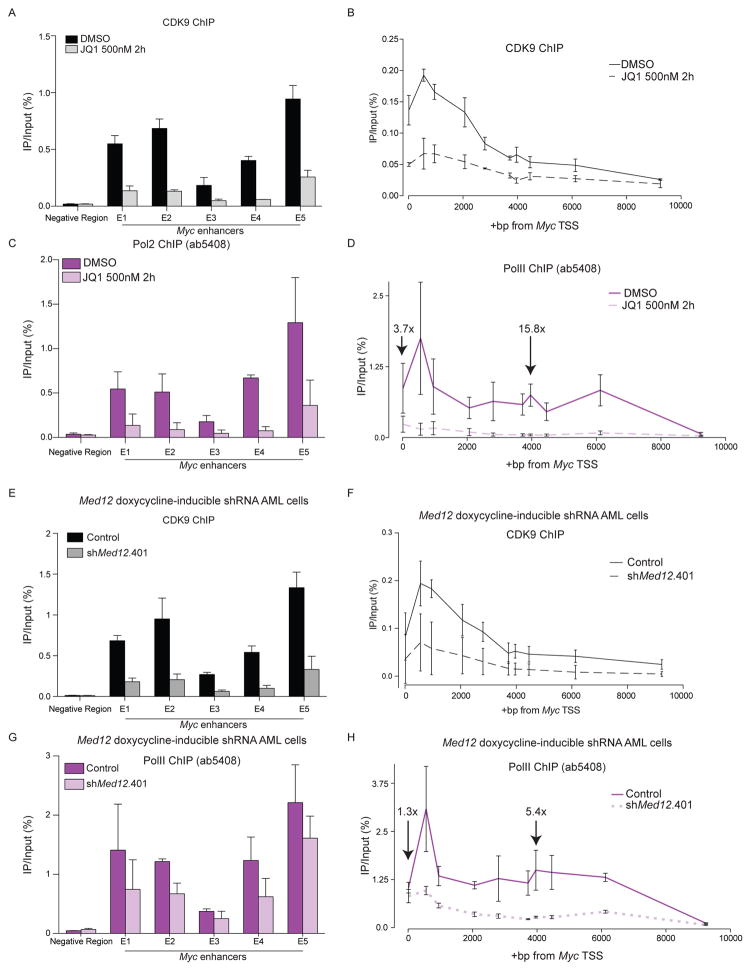
The bromodomain and extraterminal (BET) protein BRD4 can physically interact with the Mediator complex, but the relevance of this association to the therapeutic effects of BET inhibitors in cancer is unclear. Here, we show that BET inhibition causes a rapid release of Mediator from a subset of cis-regulatory elements in the genome of acute myeloid leukemia (AML) cells. These sites of Mediator eviction were highly correlated with transcriptional suppression of neighboring genes, which are enriched for targets of the transcription factor MYB and for functions related to leukemogenesis. A shRNA screen of Mediator in AML cells identified the MED12, MED13, MED23, and MED24 subunits as performing a similar regulatory function to BRD4 in this context, including a shared role in sustaining a block in myeloid maturation. These findings suggest that the interaction between BRD4 and Mediator has functional importance for gene-specific transcriptional activation and for AML maintenance.


Figures

Figure 1
Figure 1. The Mediator complex is released from the AML genome in a variable manner following JQ1 exposure
(A) Density plot of BRD4, MED1, and H3K27Ac ChIP-seq datasets in murine MLL-AF9/NrasG12D AML. Data is centered on 5,135 high-confidence BRD4-occupied elements (Roe et al., 2015). Each row represents a 10-kilobase interval surrounding a single peak. (B) ChIP-seq occupancy profiles of BRD4 and MED1 at the Myc locus following a 2 hr treatment with DMSO (vehicle) or 500 nM JQ1. (C) 178 super-enhancers defined by MED1 occupancy using the ROSE algorithm. (D–G) ChIP-seq occupancy profiles of BRD4 and MED1 at Cdk6, Mgat5, Lrrfip1, and the HoxA cluster following a 2 hr treatment with DMSO or 500 nM JQ1. See also Figure S1 and Table S4.
Figure 2
Figure 2. JQ1-induced Mediator eviction correlates with JQ1-induced transcriptional suppression
(A) Fold-change in occupancy of MED1 at 10,604 individual MED1 peaks in AML following 2 h treatment with 500 nM JQ1. The peaks are ranked in order of increasing fold change (JQ1/DMSO). The blue box highlights the 200 most JQ1-sensitive MED1 elements. Fold changes presented are the average of two independent biological replicates. (B) Fold-change in FPKM (fragments per kilobase of transcript per million) for 8,118 expressed genes in AML (defined by FPKM>5 in DMSO sample) following 6 h of 500 nM JQ1 treatment. The genes are ranked in order of increasing fold change. The numbers in parentheses are the fold-change expression rank of the indicated genes. (C) Average fold-change in FPKM after JQ1 treatment for all expressed genes (left), for genes associated with super-enhancers (center), and for genes associated with JQ1-sensitive MED1 peaks (right). The numbers in parentheses represent the number of genes matched to the class of peaks indicated. *** represents a p value < 0.0001, the result of a Mann-Whitney test. (D) Stratification of 178 MED1 super-enhancers based on whether or not they overlap with at least one of the 200 JQ1-sensitive MED1 peaks (minimum overlap 1 bp). (E) Average fold change in FPKM for genes associated with JQ1-sensitive MED1 super-enhancers and for genes associated with JQ1-insensitive MED1 super enhancers (as delineated in (D)). The numbers in parentheses represent the number of genes matched to the subclass of super-enhancer indicated. *** represents a p value < 0.0001, the result of a Mann-Whitney test. (F) ChIP-seq meta-profiles for hematopoietic TF occupancy at 200 JQ1-sensitive MED1 peaks or the remaining 10,404 MED1 peaks. (G) GREAT ontology analysis Binomial P values for 200 JQ1-sensitive MED1 peaks versus 200 random MED1 peaks. Top-ranking ontology terms for the JQ1-sensitive peaks are displayed alongside values for the same ontology terms in the random peaks. Terms in parentheses represent the ontology identifiers in the GREAT database. See also Figure S2 and Tables S2–S3.
Figure 3
Figure 3. Genetic knockdown of select Mediator subunits triggers differentiation of AML blasts
(A) Summary of negative-selection shRNA screen targeting the indicated Mediator subunits. Bars represent the average of all hairpins for each gene. Black bars highlight subunits having at least 3-fold loss of GFP-positive cells with at least two independent hairpins. shRNAs are expressed using the LMN vector. Data are represented as the mean of all hairpins for the corresponding gene ± SEM. (B) Negative-selection experiments using the indicated shRNAs chosen from the screen in (A). GFP+/shRNA+ percentages were normalized to values taken on day 2 and tracked for 8 days. Data are presented as mean ± SEM and n=3. (C–D) Flow cytometric analysis of cell-surface cKit and Mac1 following 96 h of doxycycline-induced expression of the indicated shRNAs. shRNAs were expressed using the TRMPV-Neo vector. Gating was performed on GFP+/shRNA+ cell populations. (E) Light microscopy analysis of May-Grünwald-Giemsa-stained RN2 cells after 96 h of doxycycline-induced expression of the indicated shRNAs. The images were taken with 40X objective. See also Figure S3 and Table S3.
Figure 4
Figure 4. MED12 and MED23 are required to sustain expression of BRD4, MYC, and MYB target gene signatures in AML cells
(A–B) Fold-change in FPKM for 8,393 expressed genes in AML (defined by FPKM>5 in shRen sample) following 48 h of doxycycline treatment to induce two independent shRNAs targeting Med12 (401 and 5755) or Med23 (678 and 4061) versus shRen.713. Fold change values for each gene are the average value of the independent hairpins targeting the indicated Mediator subunit. The genes are ranked in order of increasing fold change. The numbers in parentheses represent the fold change expression rank of the indicated genes. (C–D) Gene Set Enrichment Analysis (GSEA) of shMed12 and shMed23 versus shRen RNA-seq using 10,379 gene sets, including all gene sets in the Molecular Signatures Database. Signatures are plotted by their Normalized Enrichment Scores and FDR q-values according to GSEA. (E–J) Example GSEA plots from the indicated RNA-seq. Normalized Enrichment Scores (NES) and Nominal p-values (Nom p-value), as calculated by GSEA, are provided. See also Figure S4 and Table S4.
Figure 5
Figure 5. BET inhibition or MED12 knockdown cause loss of CDK9 occupancy and reduced Pol II elongation at the Myc locus
(A) ChIP-qPCR analysis of CDK9 at the Myc super-enhancer following a 2 hr treatment with DMSO or with 500 nM JQ1. (B) ChIP-qPCR analysis of CDK9 across the Myc gene body following a 2 hr treatment with DMSO or 500 nM JQ1. (C) ChIP-qPCR analysis of Pol II at the Myc super-enhancer following a 2 hr treatment with DMSO or with 500 nM JQ1. (D) ChIP-qPCR analysis of Pol II at the Myc gene body following a 2 hr treatment with DMSO or with 500 nM JQ1. Numbers above +14 bp and +3965 bp regions indicate fold change between DMSO and JQ1 ChIP-qPCR enrichment. (E) ChIP-qPCR analysis of CDK9 at the Myc super-enhancer locus following 0- or 48-hour induction of shMed12 with doxycycline (dox). TRMPV-Neo vector was used. (F) ChIP-qPCR analysis of CDK9 across the Myc gene body following 0- or 48-hour induction of shMed12 with dox. TRMPV-Neo vector was used. (G) ChIP-qPCR analysis of Pol II at the Myc enhancer locus following 0- or 48-hour induction of shMed12 with dox. TRMPV-Neo vector was used. (H) ChIP-qPCR analysis of Pol II across the Myc gene body following 0- or 48-hour induction of shMed12 with dox. Numbers above +14bp and +3965bp data indicate fold change between control and shMed12 ChIPs at these regions. TRMPV-Neo vector was used. All experiments were performed in RN2 cells. All data are presented as mean ± SEM and n=3.

References

    1. Allen BL, Taatjes DJ. The Mediator complex: a central integrator of transcription. Nature reviews Molecular cell biology. 2015;16:155–166. - PMC - PubMed
    1. Dawson MA, Prinjha RK, Dittmann A, Giotopoulos G, Bantscheff M, Chan WI, Robson SC, Chung CW, Hopf C, Savitski MM, et al. Inhibition of BET recruitment to chromatin as an effective treatment for MLL-fusion leukaemia. Nature. 2011;478:529–533. - PMC - PubMed
    1. Dey A, Chitsaz F, Abbasi A, Misteli T, Ozato K. The double bromodomain protein Brd4 binds to acetylated chromatin during interphase and mitosis. Proceedings of the National Academy of Sciences of the United States of America. 2003;100:8758–8763. - PMC - PubMed
    1. Di Micco R, Fontanals-Cirera B, Low V, Ntziachristos P, Yuen SK, Lovell CD, Dolgalev I, Yonekubo Y, Zhang G, Rusinova E, et al. Control of embryonic stem cell identity by BRD4-dependent transcriptional elongation of super-enhancer-associated pluripotency genes. Cell reports. 2014;9:234–247. - PMC - PubMed
    1. Donner AJ, Ebmeier CC, Taatjes DJ, Espinosa JM. CDK8 is a positive regulator of transcriptional elongation within the serum response network. Nature structural & molecular biology. 2010;17:194–201. - PMC - PubMed

Publication types

MeSH terms